Workflow

Mermaid diagram types, with examples

Every diagram type in Mermaid 12, plus ZenUML, with a rendered example and the code that draws it: from flowcharts and sequence diagrams to swimlane diagrams, C4, fishbone (Ishikawa) diagrams and Wardley maps. Arialine renders all of them in Slack. Paste the Mermaid and it renders exactly as written, without AI, or describe what you need and Arialine writes it. Every diagram stays editable in its Slack thread.

1Gallery

All 33 Mermaid diagram types, with examples

Each example below was rendered by Arialine from the Mermaid code shown with it. Paste the code after /arialine in Slack to get the same diagram as a board, or describe the diagram you need and Arialine writes the Mermaid for you.

2Diagram types

Flows and processes

Diagrams for processes, handoffs and plans.

Flowchart

A flowchart shows the steps of a process and the decisions between them, with boxes for steps, diamonds for decisions and arrows for the order. Teams use it for business processes, onboarding steps, support triage and algorithms.

Flowchart example made with Mermaid
Flowchart example, rendered from Mermaid by Arialine

Mermaid code for this example (starts with flowchart):

flowchart LR
  A[Customer places order] --> B{Payment authorized?}
  B -- Yes --> C[Reserve stock]
  B -- No --> D[Ask for another card]
  D --> B
  C --> E[Ship order]
  E --> F([Order delivered])

Swimlane diagram

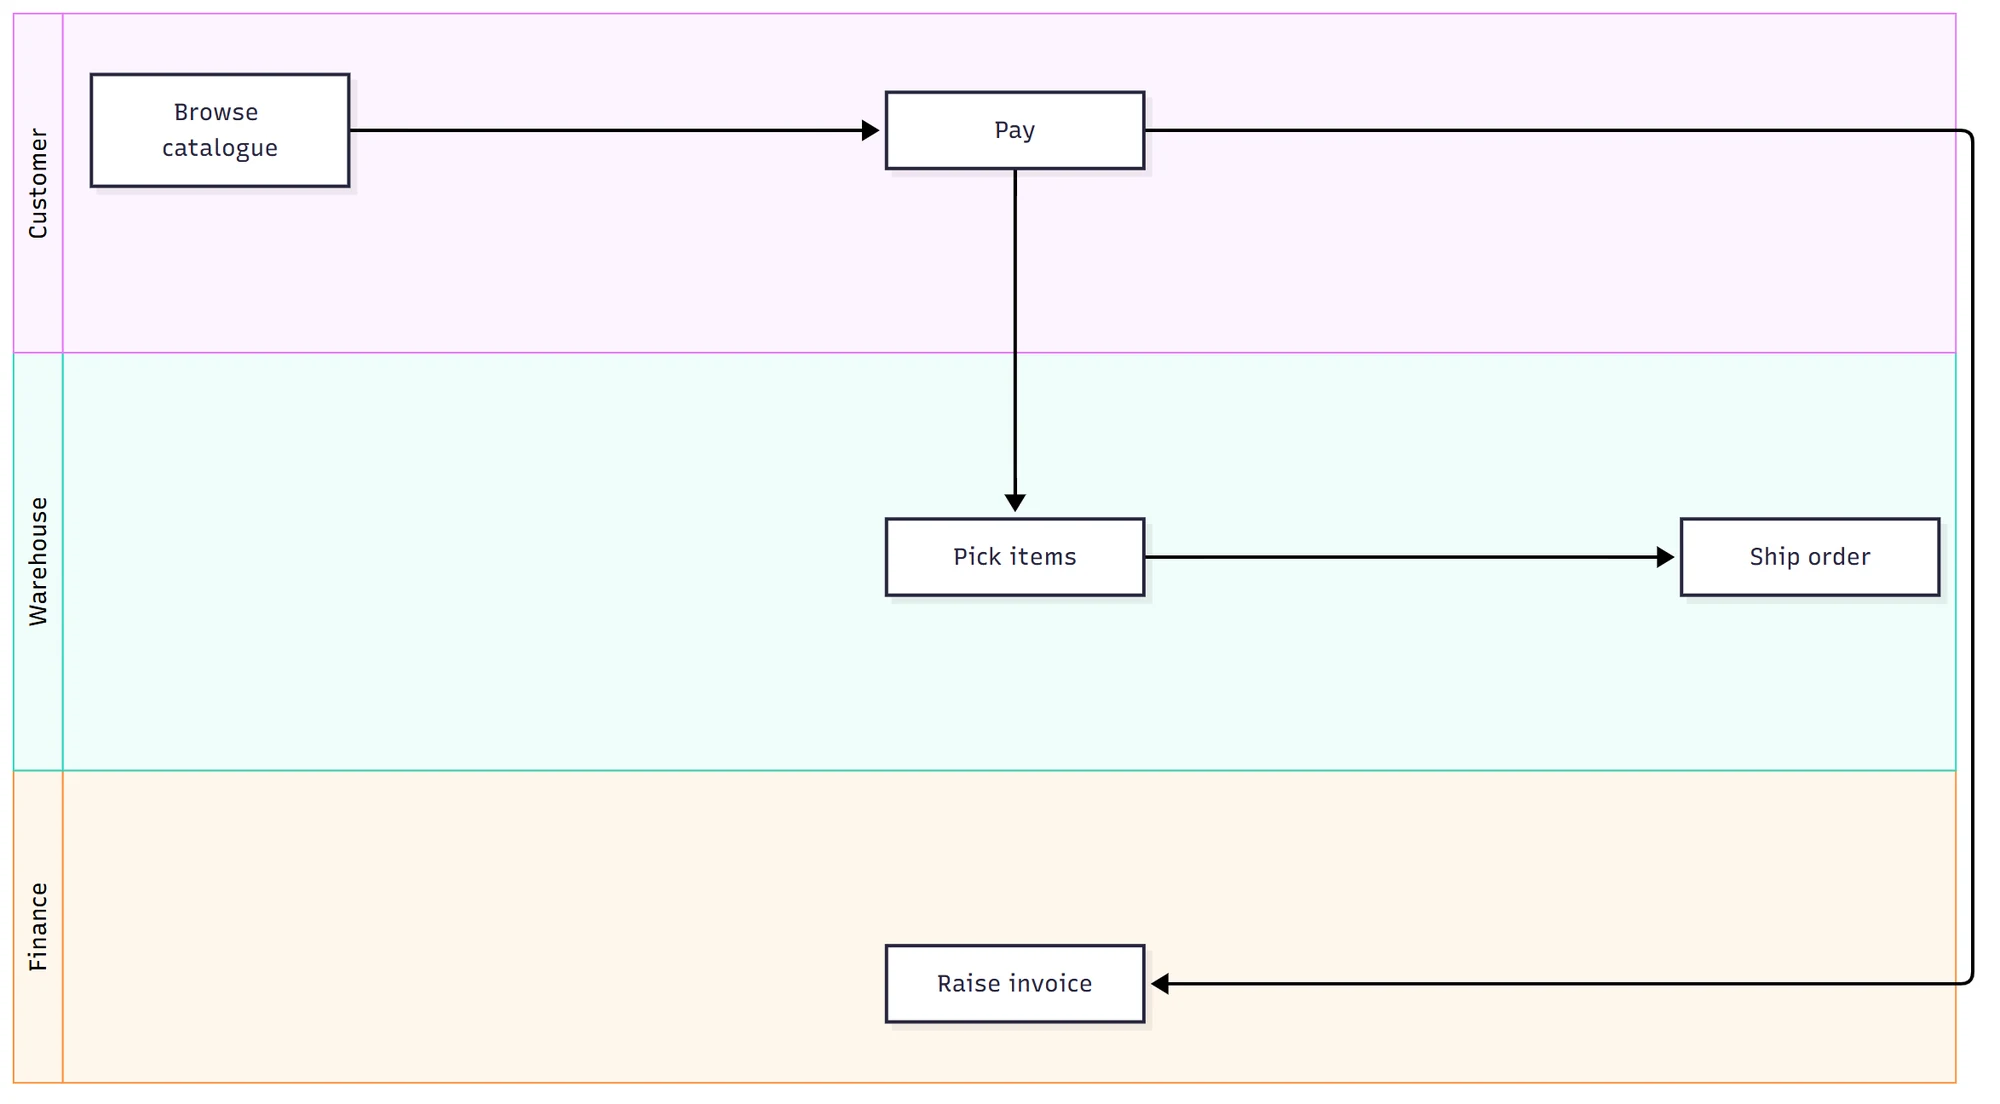
A swimlane diagram is a flowchart split into lanes, one per team, role or system, so you can see who does each step and where work is handed over. It is the usual way to map cross-team processes such as order fulfilment, refunds or incident escalation.

Swimlane diagram example made with Mermaid
Swimlane diagram example, rendered from Mermaid by Arialine

Mermaid code for this example (starts with swimlane-beta):

swimlane-beta LR
  subgraph Customer
    Browse[Browse catalogue]
    Pay[Pay]
  end
  subgraph Warehouse
    Pick[Pick items]
    Ship[Ship order]
  end
  subgraph Finance
    Invoice[Raise invoice]
  end
  Browse --> Pay
  Pay --> Pick
  Pick --> Ship
  Pay --> Invoice

User journey

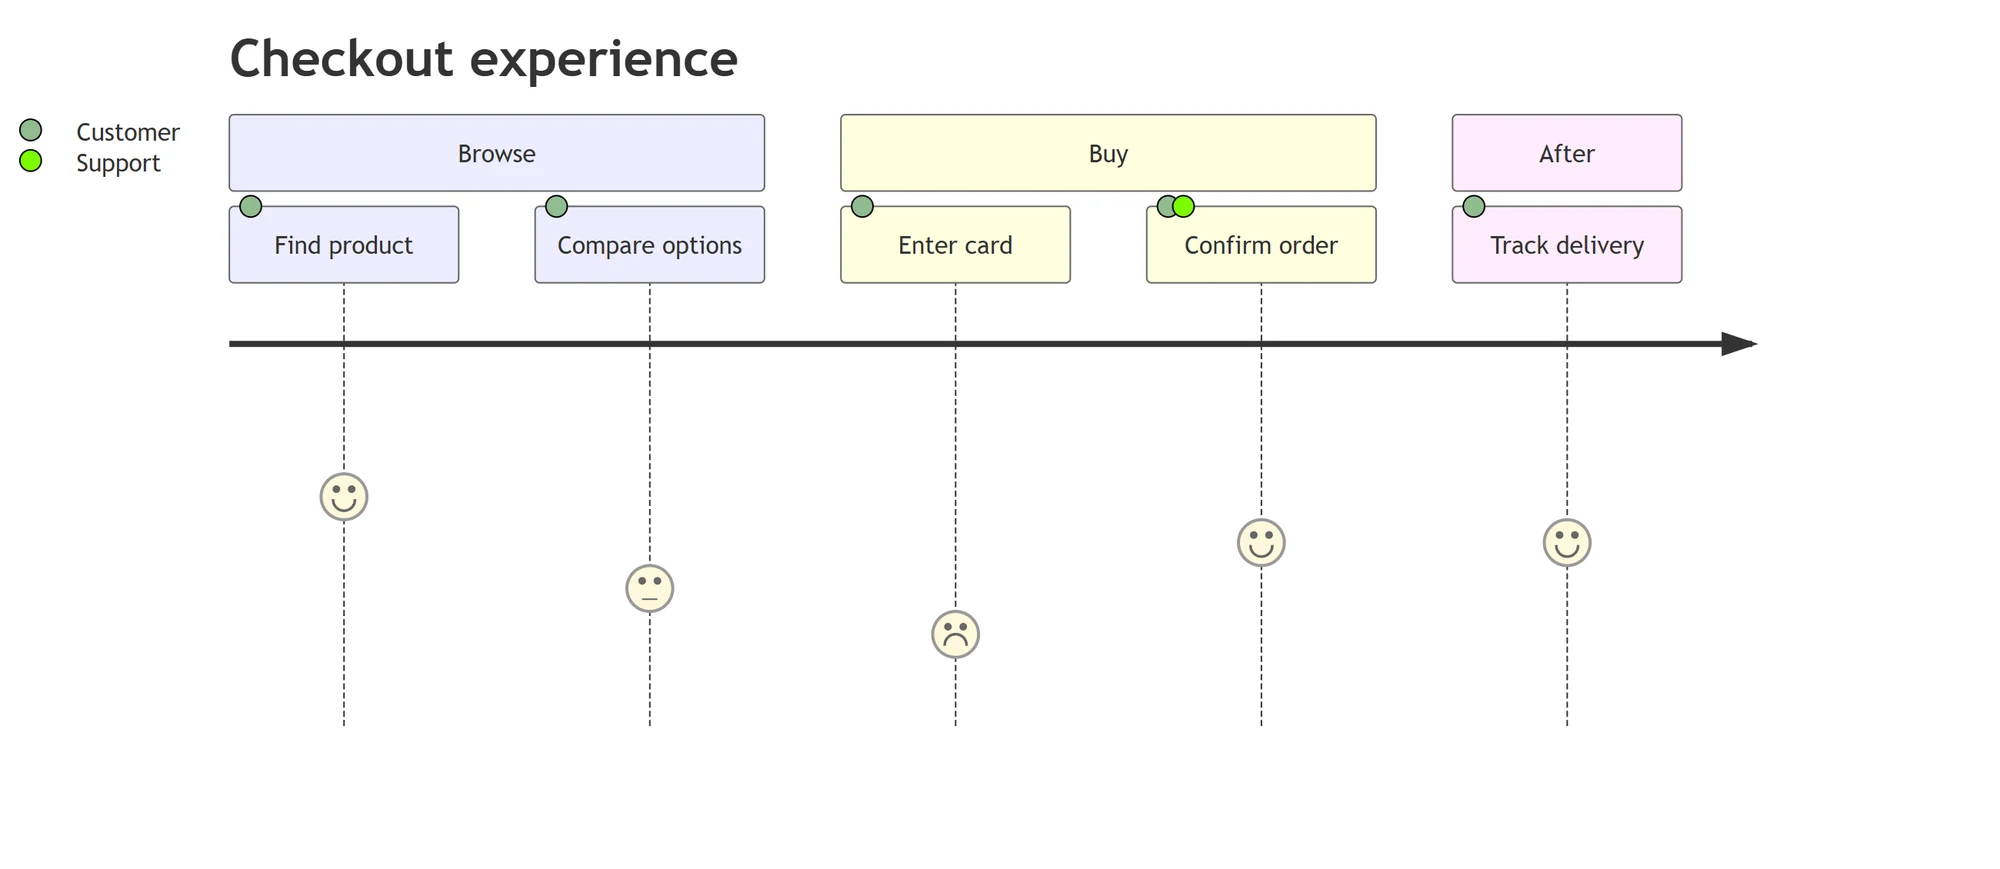
A user journey diagram lists the steps a person takes to reach a goal, grouped into sections and scored from 1 to 5 for how each step feels. Product and UX teams use it to find the painful steps in onboarding, checkout or support.

User journey example made with Mermaid
User journey example, rendered from Mermaid by Arialine

Mermaid code for this example (starts with journey):

journey
  title Checkout experience
  section Browse
    Find product: 5: Customer
    Compare options: 3: Customer
  section Buy
    Enter card: 2: Customer
    Confirm order: 4: Customer, Support
  section After
    Track delivery: 4: Customer

Gantt chart

A Gantt chart shows tasks as bars on a timeline, with start dates, durations and dependencies between tasks. It is used for project plans, release schedules and migrations.

Gantt chart example made with Mermaid
Gantt chart example, rendered from Mermaid by Arialine

Mermaid code for this example (starts with gantt):

gantt
  title Payments migration
  dateFormat YYYY-MM-DD
  section Design
    Architecture review :done, a1, 2026-09-01, 5d
    Security review :a2, after a1, 4d
  section Build
    New payment service :b1, after a2, 12d
    Retry queue :b2, after a2, 8d
  section Launch
    Gradual rollout :c1, after b1, 6d

Timeline

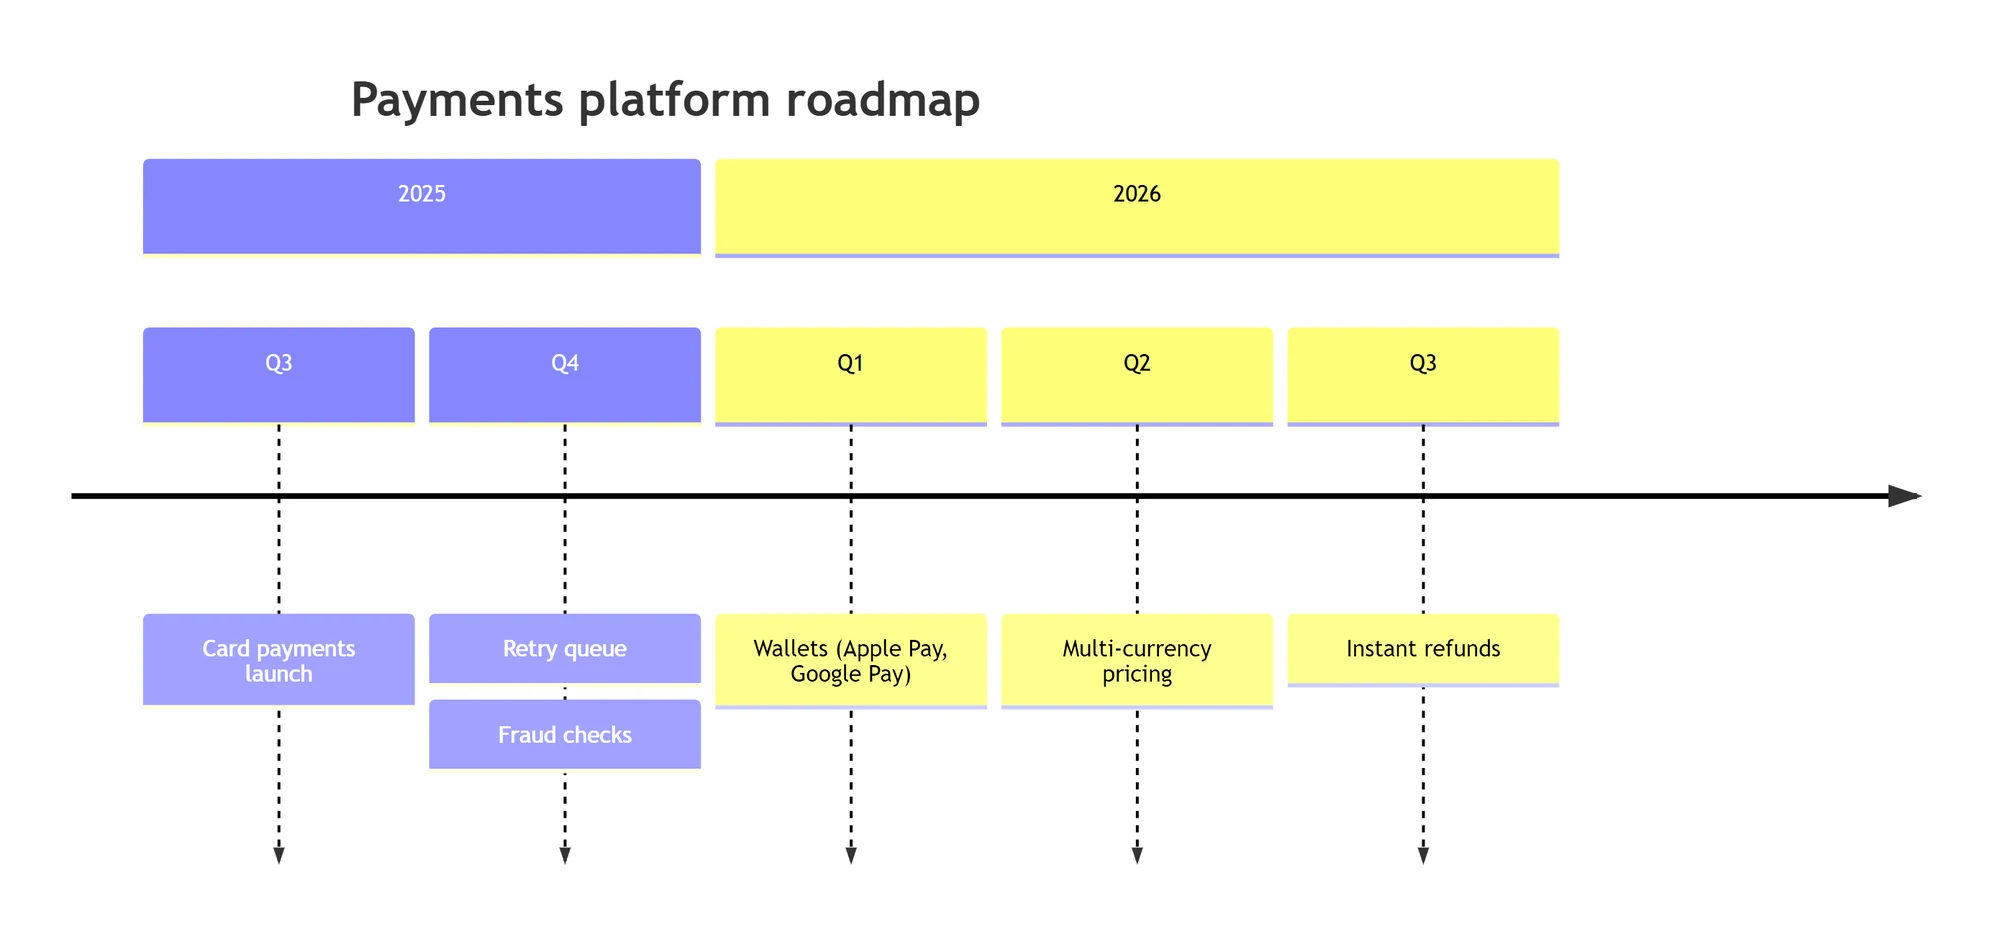
A timeline diagram places events in chronological order, optionally grouped into sections such as years or quarters. It suits roadmaps, product history and incident timelines.

Timeline example made with Mermaid
Timeline example, rendered from Mermaid by Arialine

Mermaid code for this example (starts with timeline):

timeline
  title Payments platform roadmap
  section 2025
    Q3 : Card payments launch
    Q4 : Retry queue : Fraud checks
  section 2026
    Q1 : Wallets (Apple Pay, Google Pay)
    Q2 : Multi-currency pricing
    Q3 : Instant refunds
3Diagram types

Software design

UML, C4 and architecture diagrams for designing and documenting software.

Sequence diagram

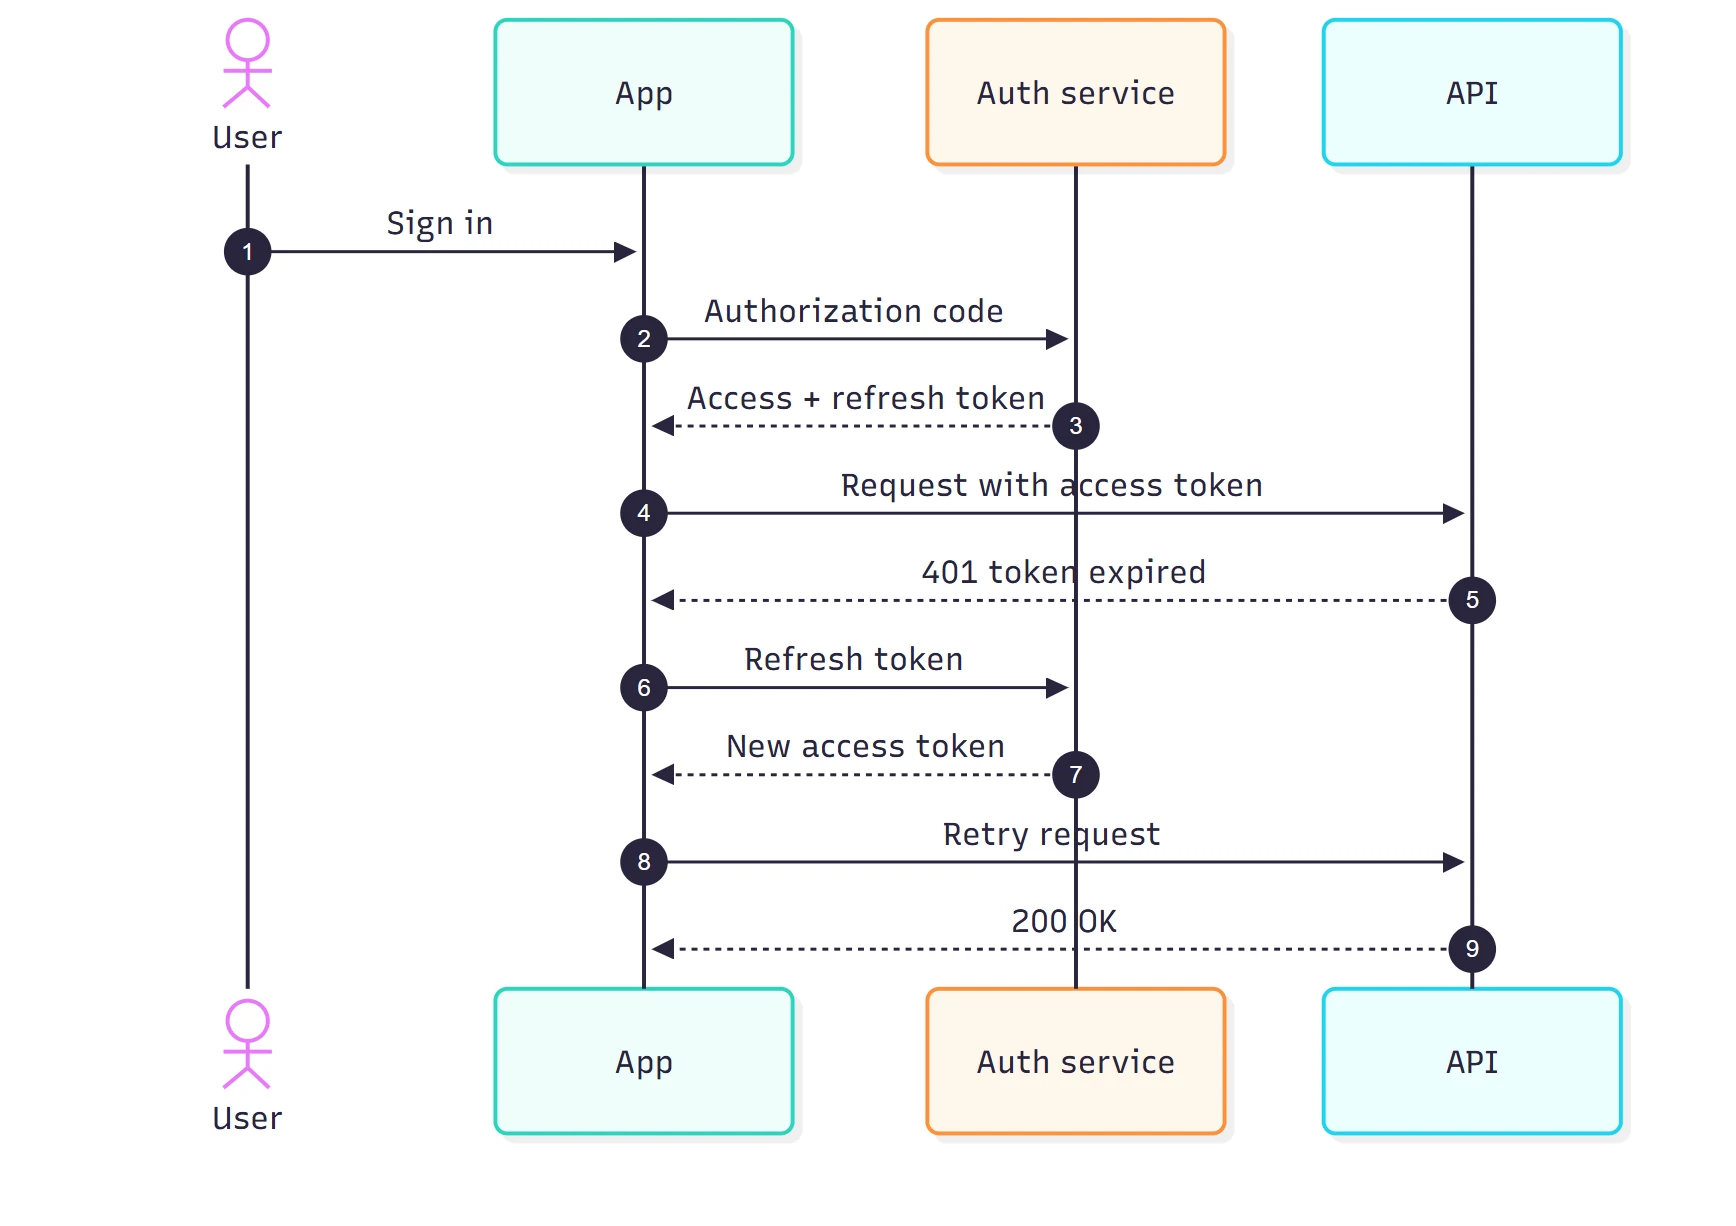
A sequence diagram shows how people and systems exchange messages over time: participants across the top, messages as arrows in the order they happen. It is the standard way to document API calls, authentication flows and service-to-service communication.

Sequence diagram example made with Mermaid
Sequence diagram example, rendered from Mermaid by Arialine

Mermaid code for this example (starts with sequenceDiagram):

sequenceDiagram
  autonumber
  actor User
  participant App
  participant Auth as Auth service
  participant API
  User->>App: Sign in
  App->>Auth: Authorization code
  Auth-->>App: Access + refresh token
  App->>API: Request with access token
  API-->>App: 401 token expired
  App->>Auth: Refresh token
  Auth-->>App: New access token
  App->>API: Retry request
  API-->>App: 200 OK

ZenUML sequence diagram

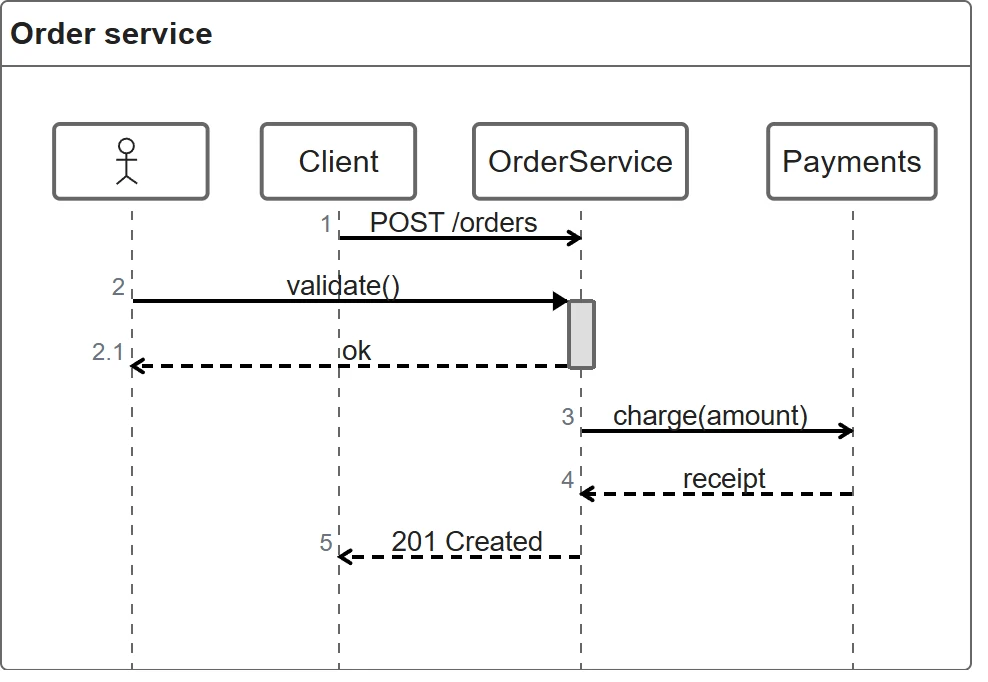
ZenUML is an alternative sequence diagram syntax that reads like code: method calls, return values and nested blocks. Developers use it to describe a request's path through services the way they would write it.

ZenUML sequence diagram example made with Mermaid
ZenUML sequence diagram example, rendered from Mermaid by Arialine

Mermaid code for this example (starts with zenuml):

zenuml
  title Order service
  Client->OrderService: POST /orders
  OrderService.validate() {
    return ok
  }
  OrderService->Payments: charge(amount)
  @return
  Payments->OrderService: receipt
  @return
  OrderService->Client: 201 Created

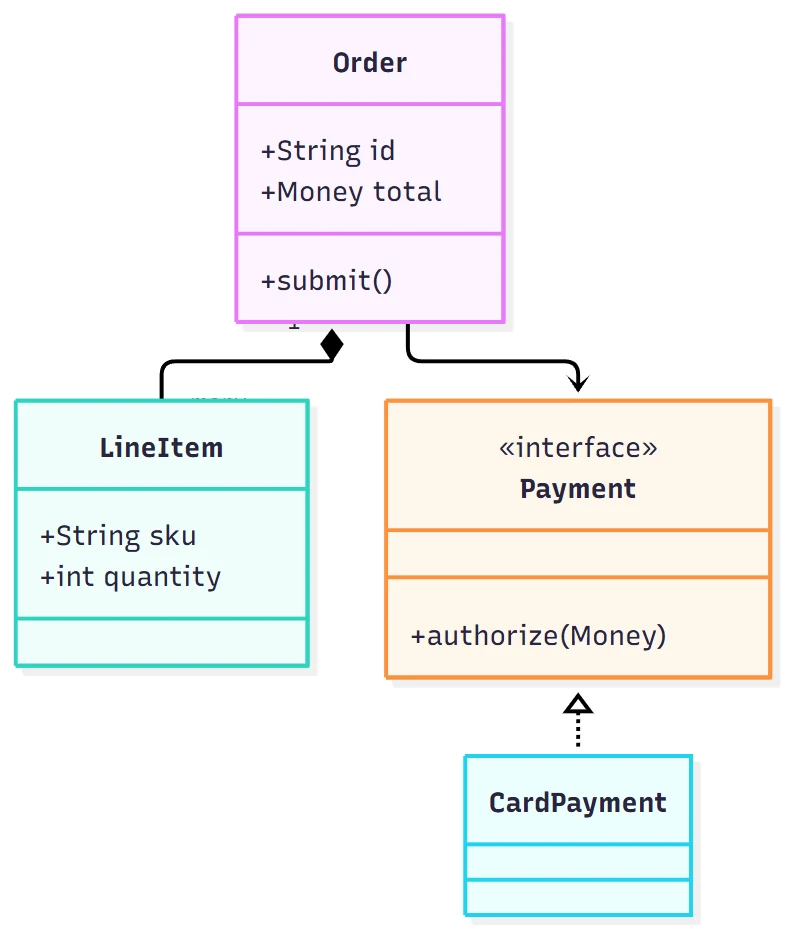
Class diagram

A UML class diagram shows classes with their attributes and methods, and the relationships between them: inheritance, composition, association and interfaces. It is used for object models and domain design.

Class diagram example made with Mermaid
Class diagram example, rendered from Mermaid by Arialine

Mermaid code for this example (starts with classDiagram):

classDiagram
  class Order {
    +String id
    +Money total
    +submit()
  }
  class LineItem {
    +String sku
    +int quantity
  }
  class Payment {
    <<interface>>
    +authorize(Money)
  }
  class CardPayment
  Order "1" *-- "many" LineItem
  Order --> Payment
  Payment <|.. CardPayment

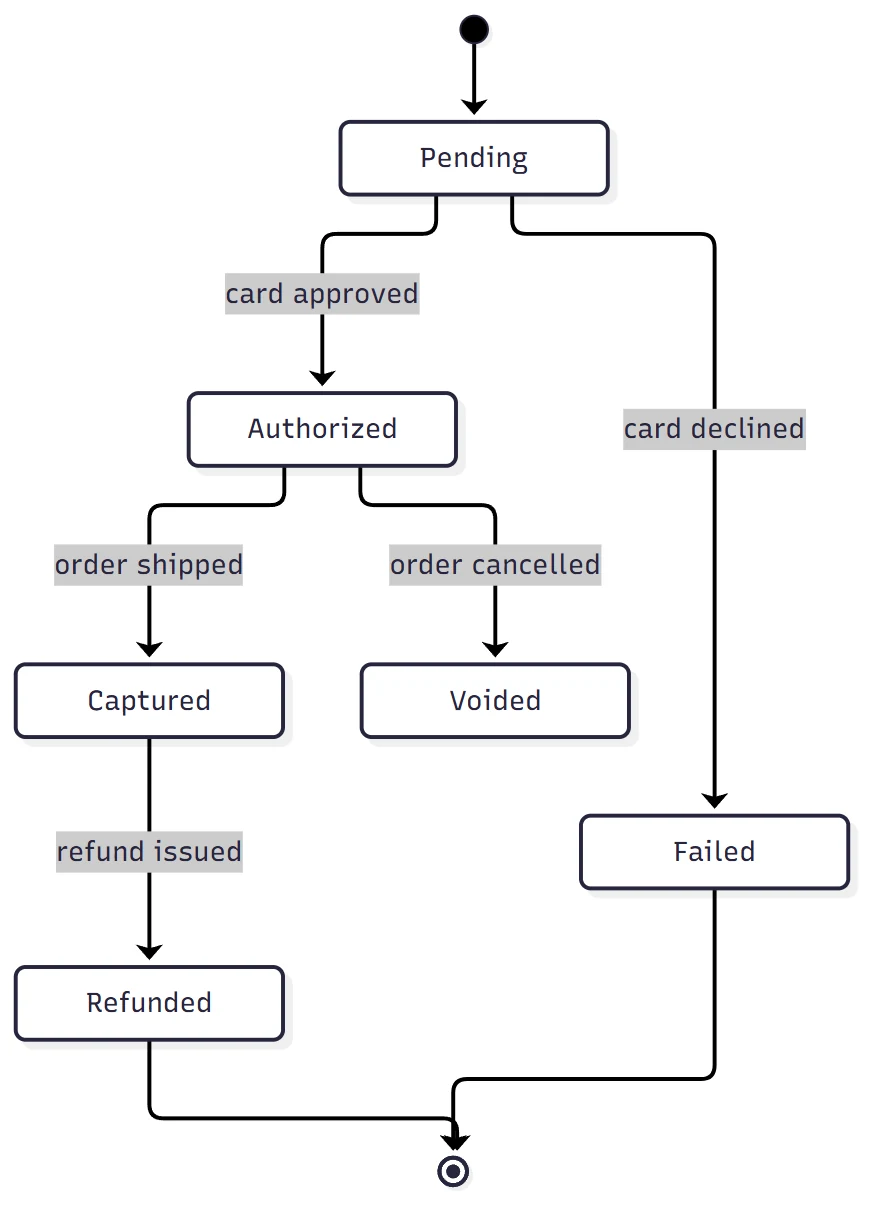
State diagram

A state diagram (state machine) shows the states something can be in and the events that move it from one state to another. Common examples are order status, payment lifecycles and ticket workflows.

State diagram example made with Mermaid
State diagram example, rendered from Mermaid by Arialine

Mermaid code for this example (starts with stateDiagram-v2):

stateDiagram-v2
  [*] --> Pending
  Pending --> Authorized: card approved
  Pending --> Failed: card declined
  Authorized --> Captured: order shipped
  Authorized --> Voided: order cancelled
  Captured --> Refunded: refund issued
  Failed --> [*]
  Refunded --> [*]

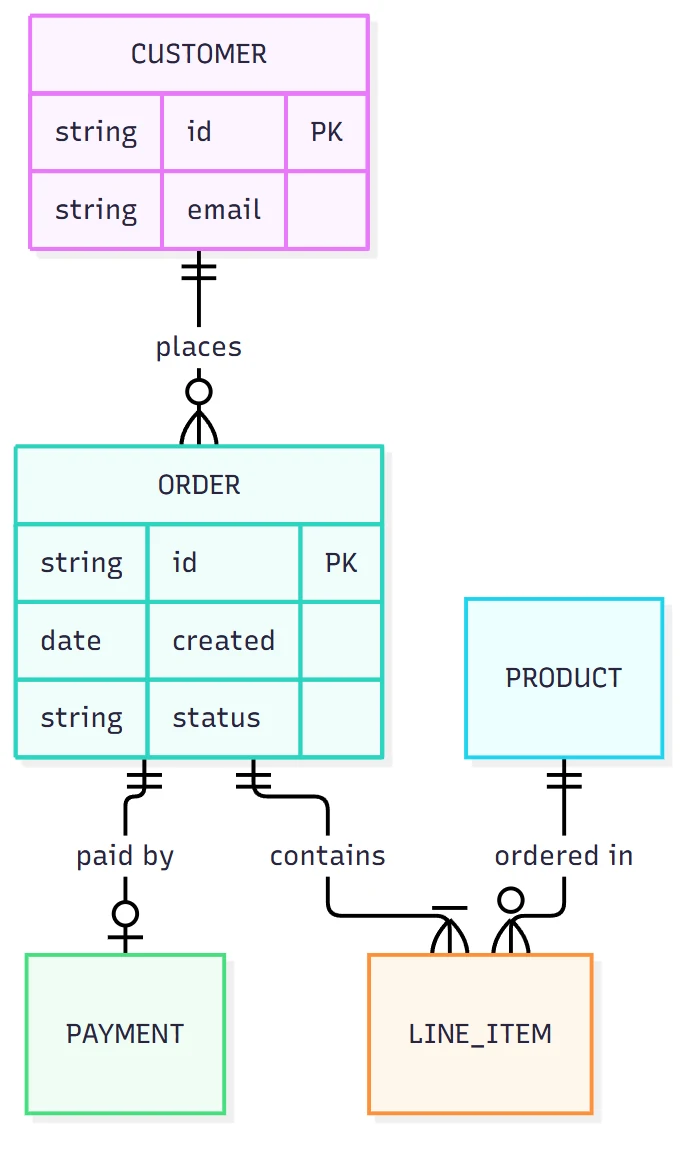
Entity relationship (ER) diagram

An entity relationship (ER) diagram shows the tables or entities in a data model, their fields and keys, and how they relate (one-to-one, one-to-many, many-to-many). It is used to design and document databases.

Entity relationship (ER) diagram example made with Mermaid
Entity relationship (ER) diagram example, rendered from Mermaid by Arialine

Mermaid code for this example (starts with erDiagram):

erDiagram
  CUSTOMER ||--o{ ORDER : places
  ORDER ||--|{ LINE_ITEM : contains
  PRODUCT ||--o{ LINE_ITEM : "ordered in"
  ORDER ||--o| PAYMENT : "paid by"
  CUSTOMER {
    string id PK
    string email
  }
  ORDER {
    string id PK
    date created
    string status
  }

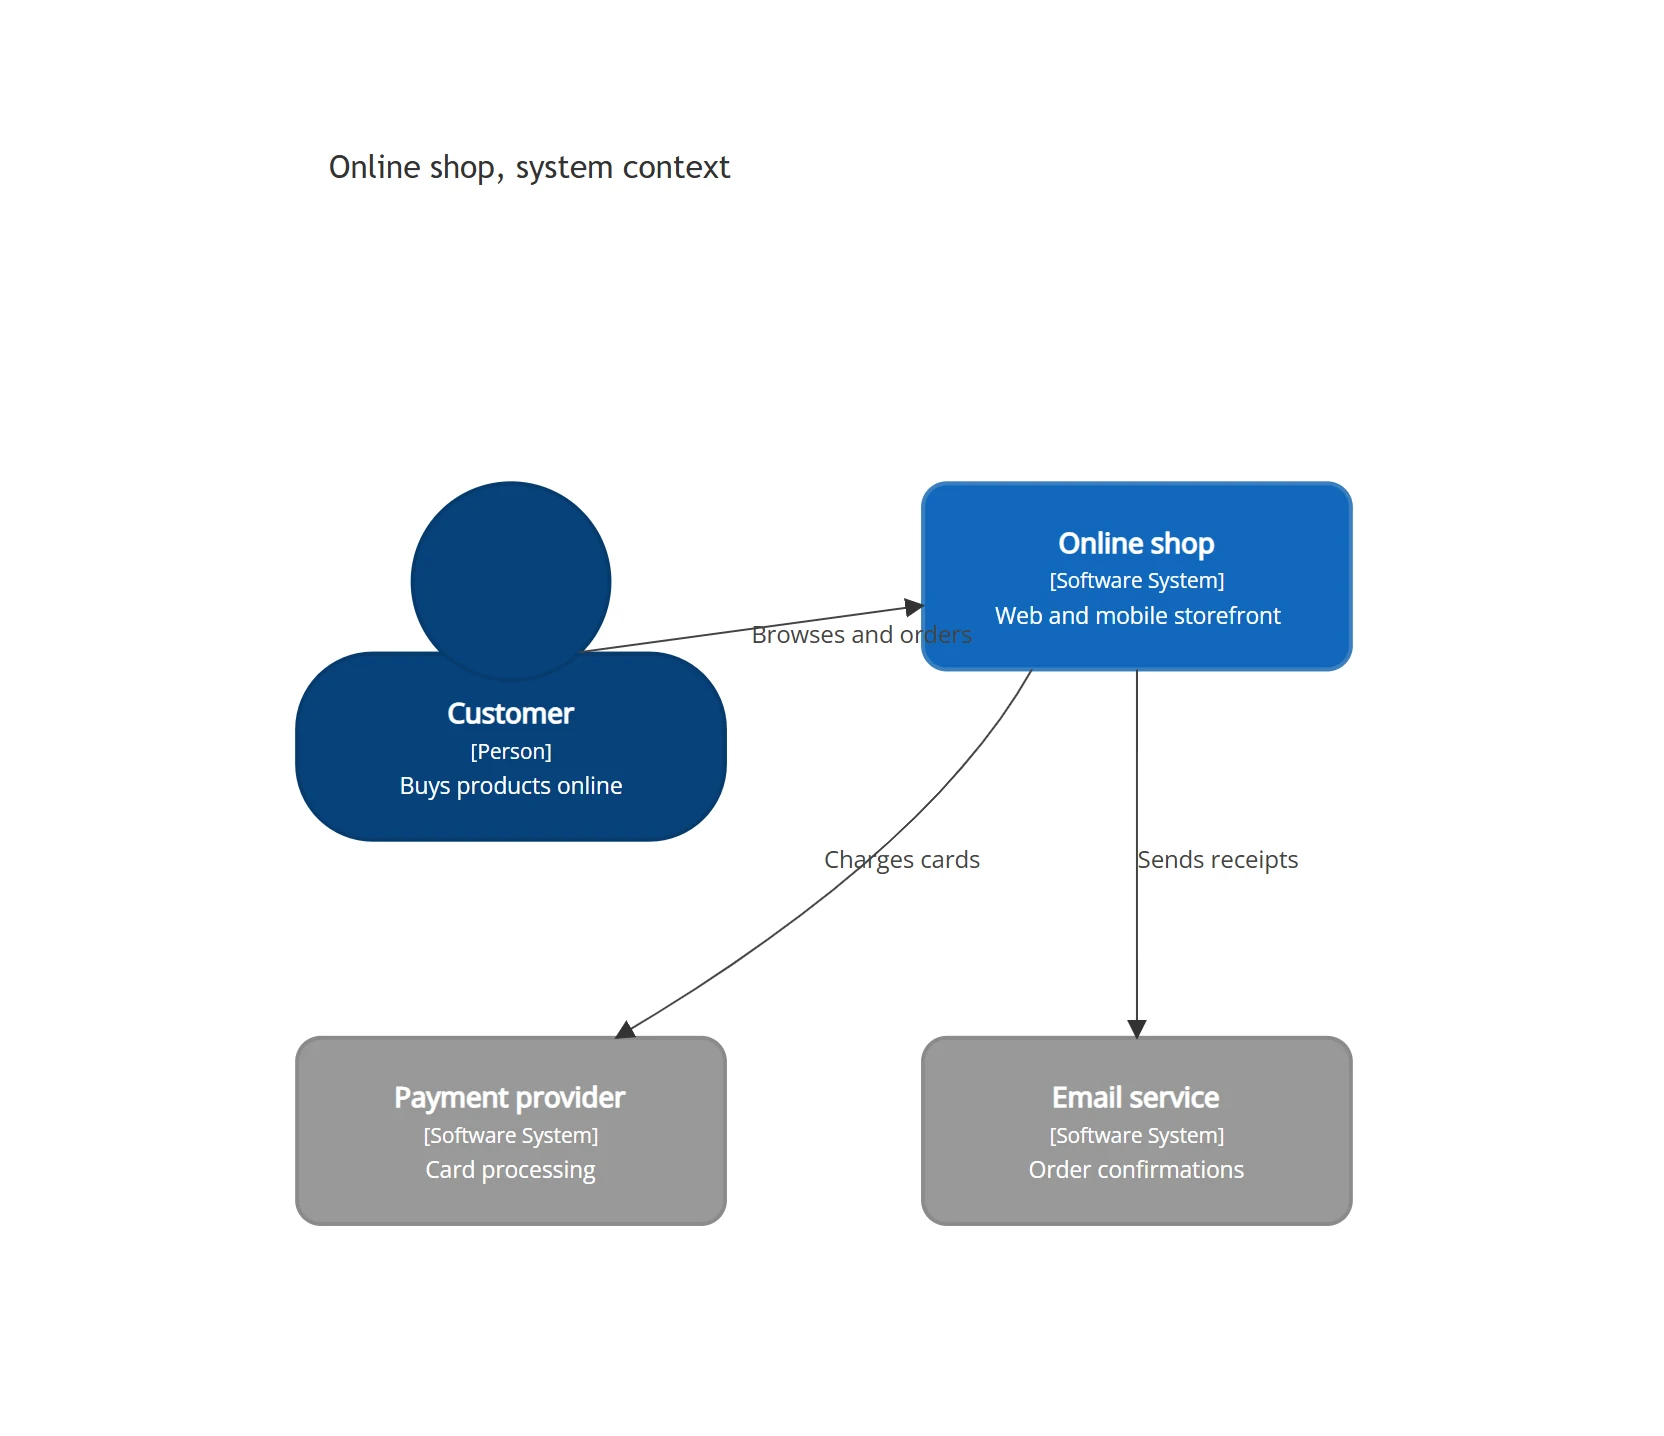
C4 diagram

A C4 diagram describes software architecture at four levels: system context, containers, components and code. A system context diagram, shown here, places the system among its users and the external systems it depends on.

C4 diagram example made with Mermaid
C4 diagram example, rendered from Mermaid by Arialine

Mermaid code for this example (starts with C4Context):

C4Context
  title Online shop, system context
  Person(customer, "Customer", "Buys products online")
  System(shop, "Online shop", "Web and mobile storefront")
  System_Ext(payments, "Payment provider", "Card processing")
  System_Ext(email, "Email service", "Order confirmations")
  Rel(customer, shop, "Browses and orders")
  Rel(shop, payments, "Charges cards")
  Rel(shop, email, "Sends receipts")

Architecture diagram

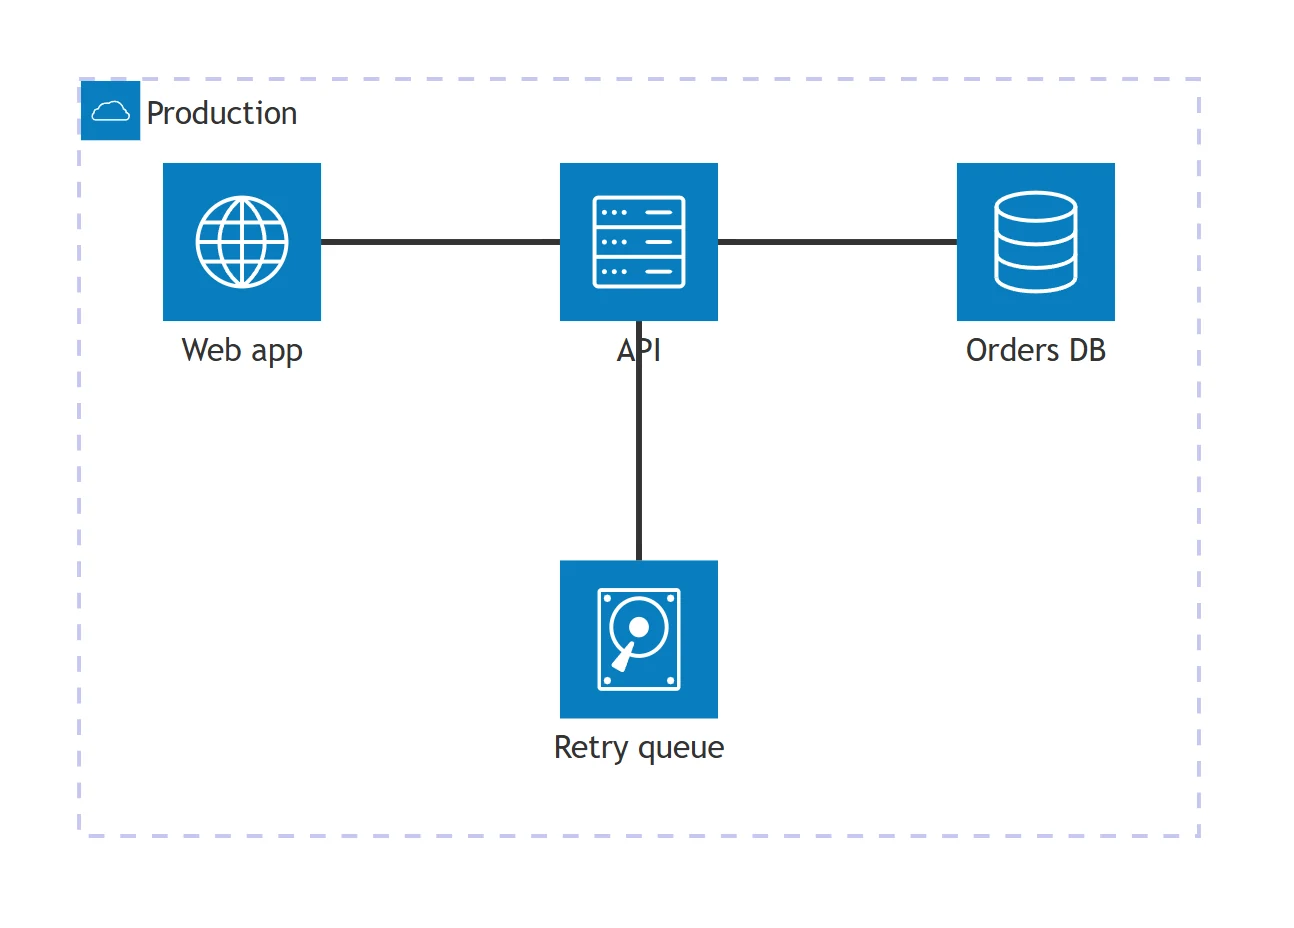
An architecture diagram shows the services, databases, queues and cloud resources of a system and how they connect, using icons and groups. Teams use it for system design reviews and infrastructure documentation.

Architecture diagram example made with Mermaid
Architecture diagram example, rendered from Mermaid by Arialine

Mermaid code for this example (starts with architecture-beta):

architecture-beta
  group cloud(cloud)[Production]
  service web(internet)[Web app] in cloud
  service api(server)[API] in cloud
  service db(database)[Orders DB] in cloud
  service queue(disk)[Retry queue] in cloud
  web:R -- L:api
  api:R -- L:db
  api:B -- T:queue

Block diagram

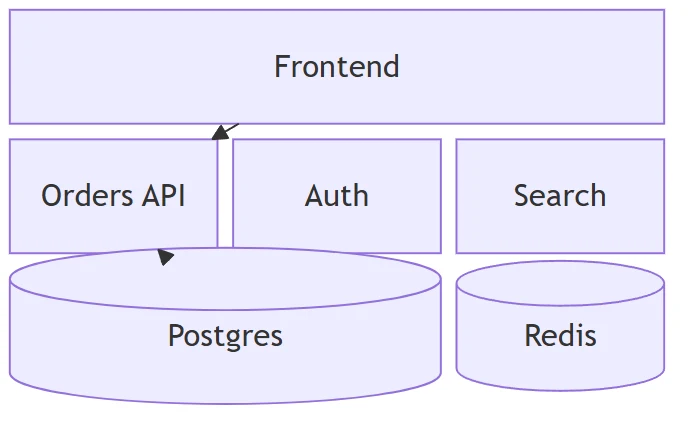
A block diagram lays out the parts of a system as blocks in columns and rows, with arrows for the main connections. It gives a simple, high-level picture of a system's structure.

Block diagram example made with Mermaid
Block diagram example, rendered from Mermaid by Arialine

Mermaid code for this example (starts with block-beta):

block-beta
  columns 3
  Frontend:3
  API["Orders API"] Auth["Auth"] Search["Search"]
  DB[("Postgres")]:2 Cache[("Redis")]
  Frontend --> API
  API --> DB

Packet diagram

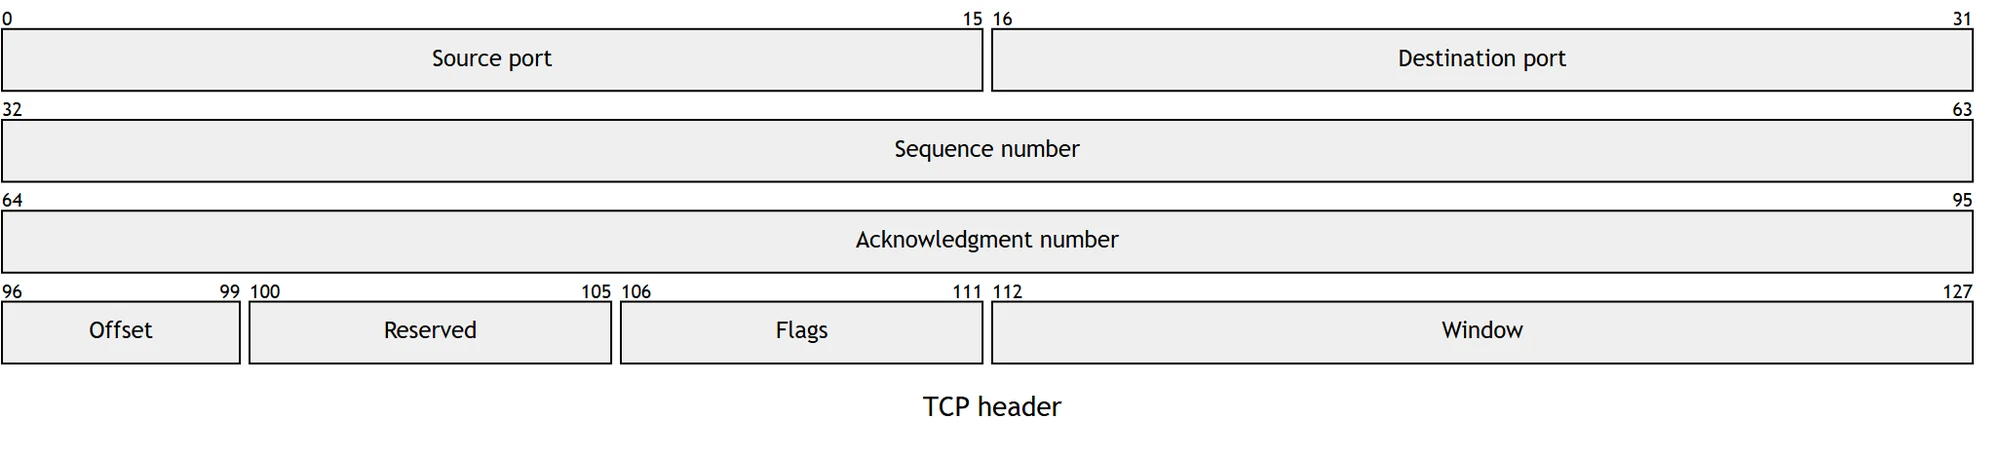
A packet diagram shows the bit layout of a network packet or binary format: which field occupies which bits. It is used to document protocols such as TCP, UDP or custom message formats.

Packet diagram example made with Mermaid
Packet diagram example, rendered from Mermaid by Arialine

Mermaid code for this example (starts with packet):

packet
  title TCP header
  0-15: "Source port"
  16-31: "Destination port"
  32-63: "Sequence number"
  64-95: "Acknowledgment number"
  96-99: "Offset"
  100-105: "Reserved"
  106-111: "Flags"
  112-127: "Window"

Requirement diagram

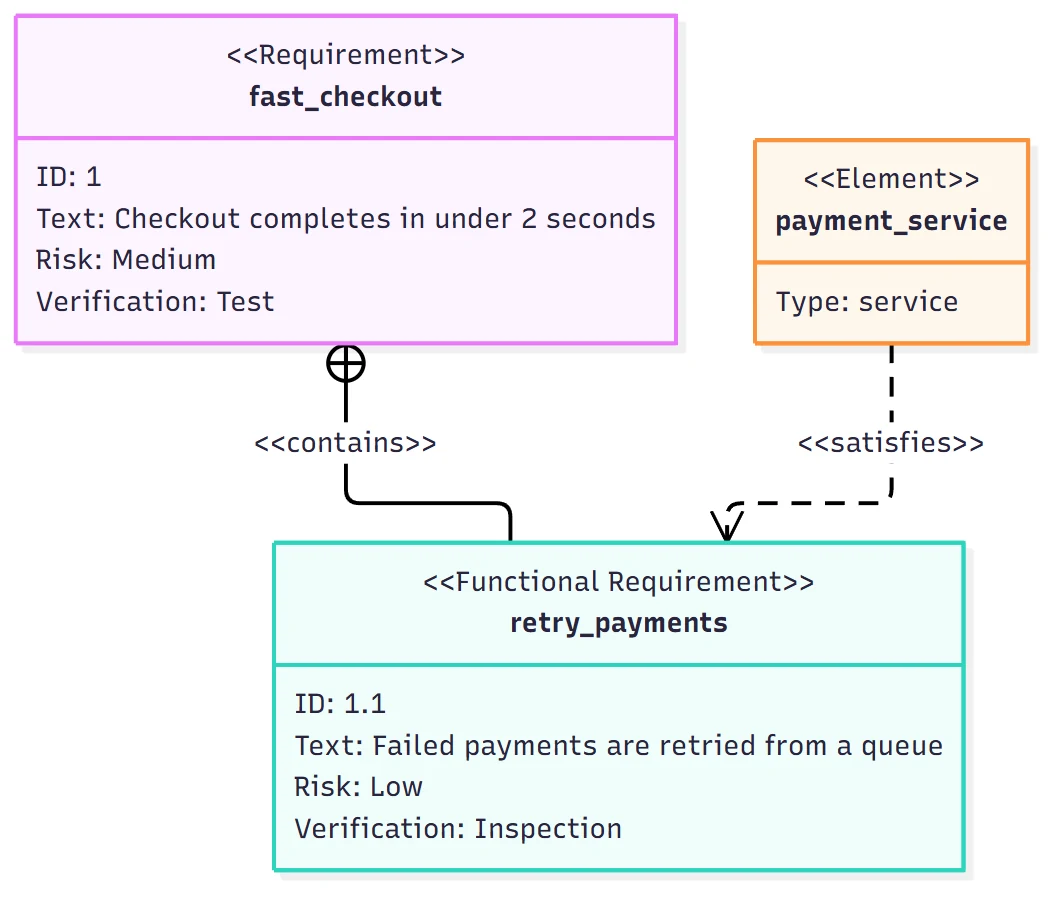
A requirement diagram (SysML) lists requirements with their ID, risk and verification method, and links them to the elements that satisfy or verify them. It helps teams trace requirements to design.

Requirement diagram example made with Mermaid
Requirement diagram example, rendered from Mermaid by Arialine

Mermaid code for this example (starts with requirementDiagram):

requirementDiagram
  requirement fast_checkout {
    id: 1
    text: Checkout completes in under 2 seconds
    risk: medium
    verifymethod: test
  }
  functionalRequirement retry_payments {
    id: 1.1
    text: Failed payments are retried from a queue
    risk: low
    verifymethod: inspection
  }
  element payment_service {
    type: service
  }
  payment_service - satisfies -> retry_payments
  fast_checkout - contains -> retry_payments
4Diagram types

Requirements and modelling

Diagrams for agreeing on scope, domain events and syntax.

Use case diagram

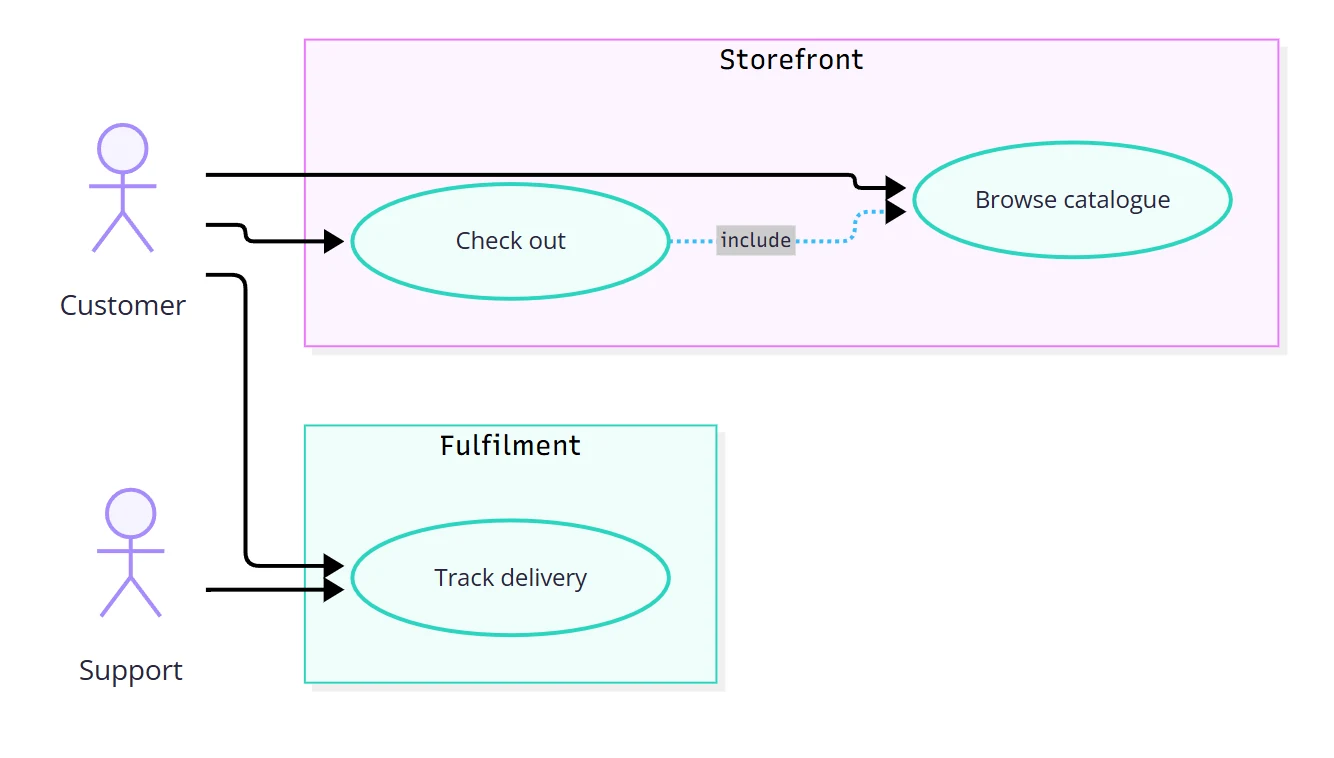
A UML use case diagram shows the actors of a system, the use cases they take part in, and the system boundary around them. It is used early in a project to agree on scope.

Use case diagram example made with Mermaid
Use case diagram example, rendered from Mermaid by Arialine

Mermaid code for this example (starts with usecase-beta):

usecase-beta
direction LR
actor Customer
actor Support
systemBoundary Storefront
  Browse("Browse catalogue")
  Checkout("Check out")
end
systemBoundary Fulfilment
  Track("Track delivery")
end
Customer --> Browse
Customer --> Checkout
Customer --> Track
Support --> Track
Checkout ..> : include Browse

Event modeling diagram

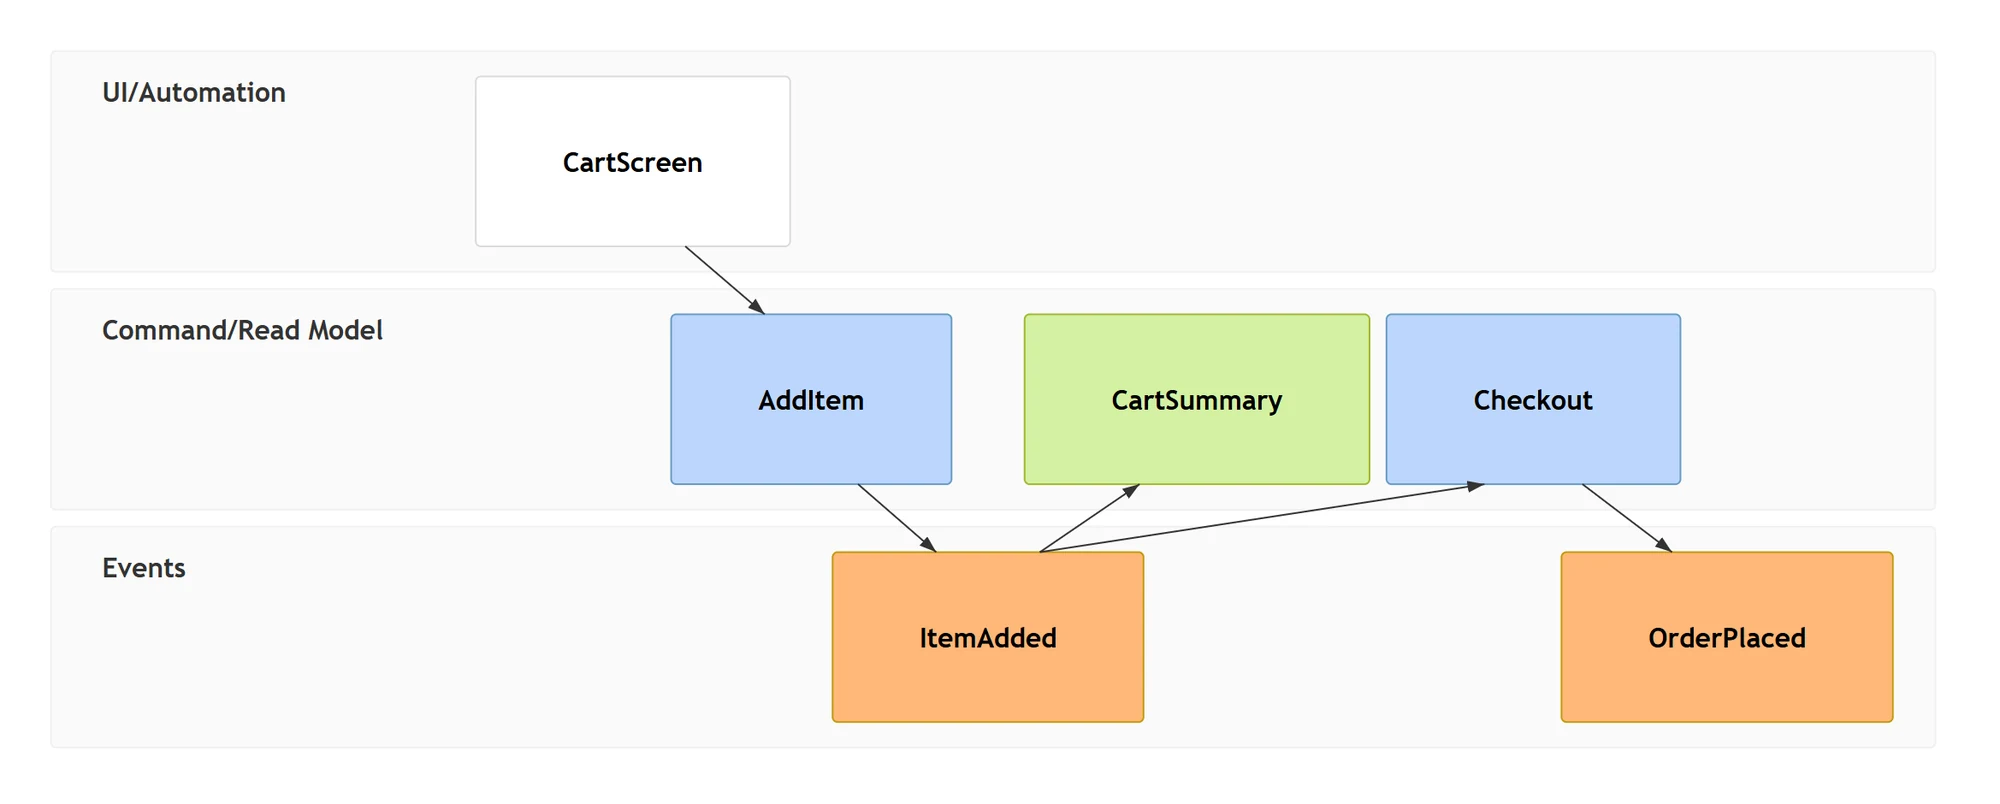
An event modeling diagram lays out an information system as a timeline of screens, commands, events and read models, in swimlanes. Teams use it to design event-sourced and CQRS systems together.

Event modeling diagram example made with Mermaid
Event modeling diagram example, rendered from Mermaid by Arialine

Mermaid code for this example (starts with eventmodeling):

eventmodeling

tf 01 ui CartScreen
tf 02 cmd AddItem
tf 03 evt ItemAdded
tf 04 rmo CartSummary
tf 05 cmd Checkout
tf 06 evt OrderPlaced

Railroad (syntax) diagram

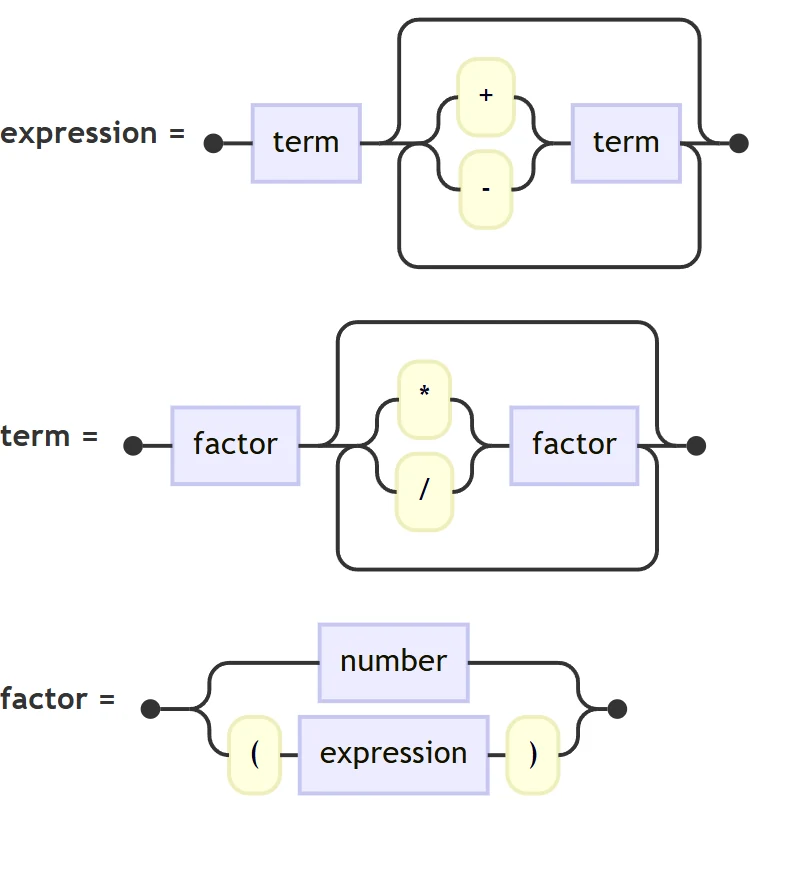
A railroad diagram (syntax diagram) draws a grammar as tracks: follow any path from left to right to produce a valid expression. It is used to document query languages, configuration syntax and APIs.

Railroad (syntax) diagram example made with Mermaid
Railroad (syntax) diagram example, rendered from Mermaid by Arialine

Mermaid code for this example (starts with railroad-ebnf-beta):

railroad-ebnf-beta
title "Arithmetic expression"

expression = term ( ( "+" | "-" ) term )* ;
term = factor ( ( "*" | "/" ) factor )* ;
factor = number | "(" expression ")" ;
5Diagram types

Strategy and analysis

Frameworks for strategy, root cause analysis and prioritization.

Wardley map

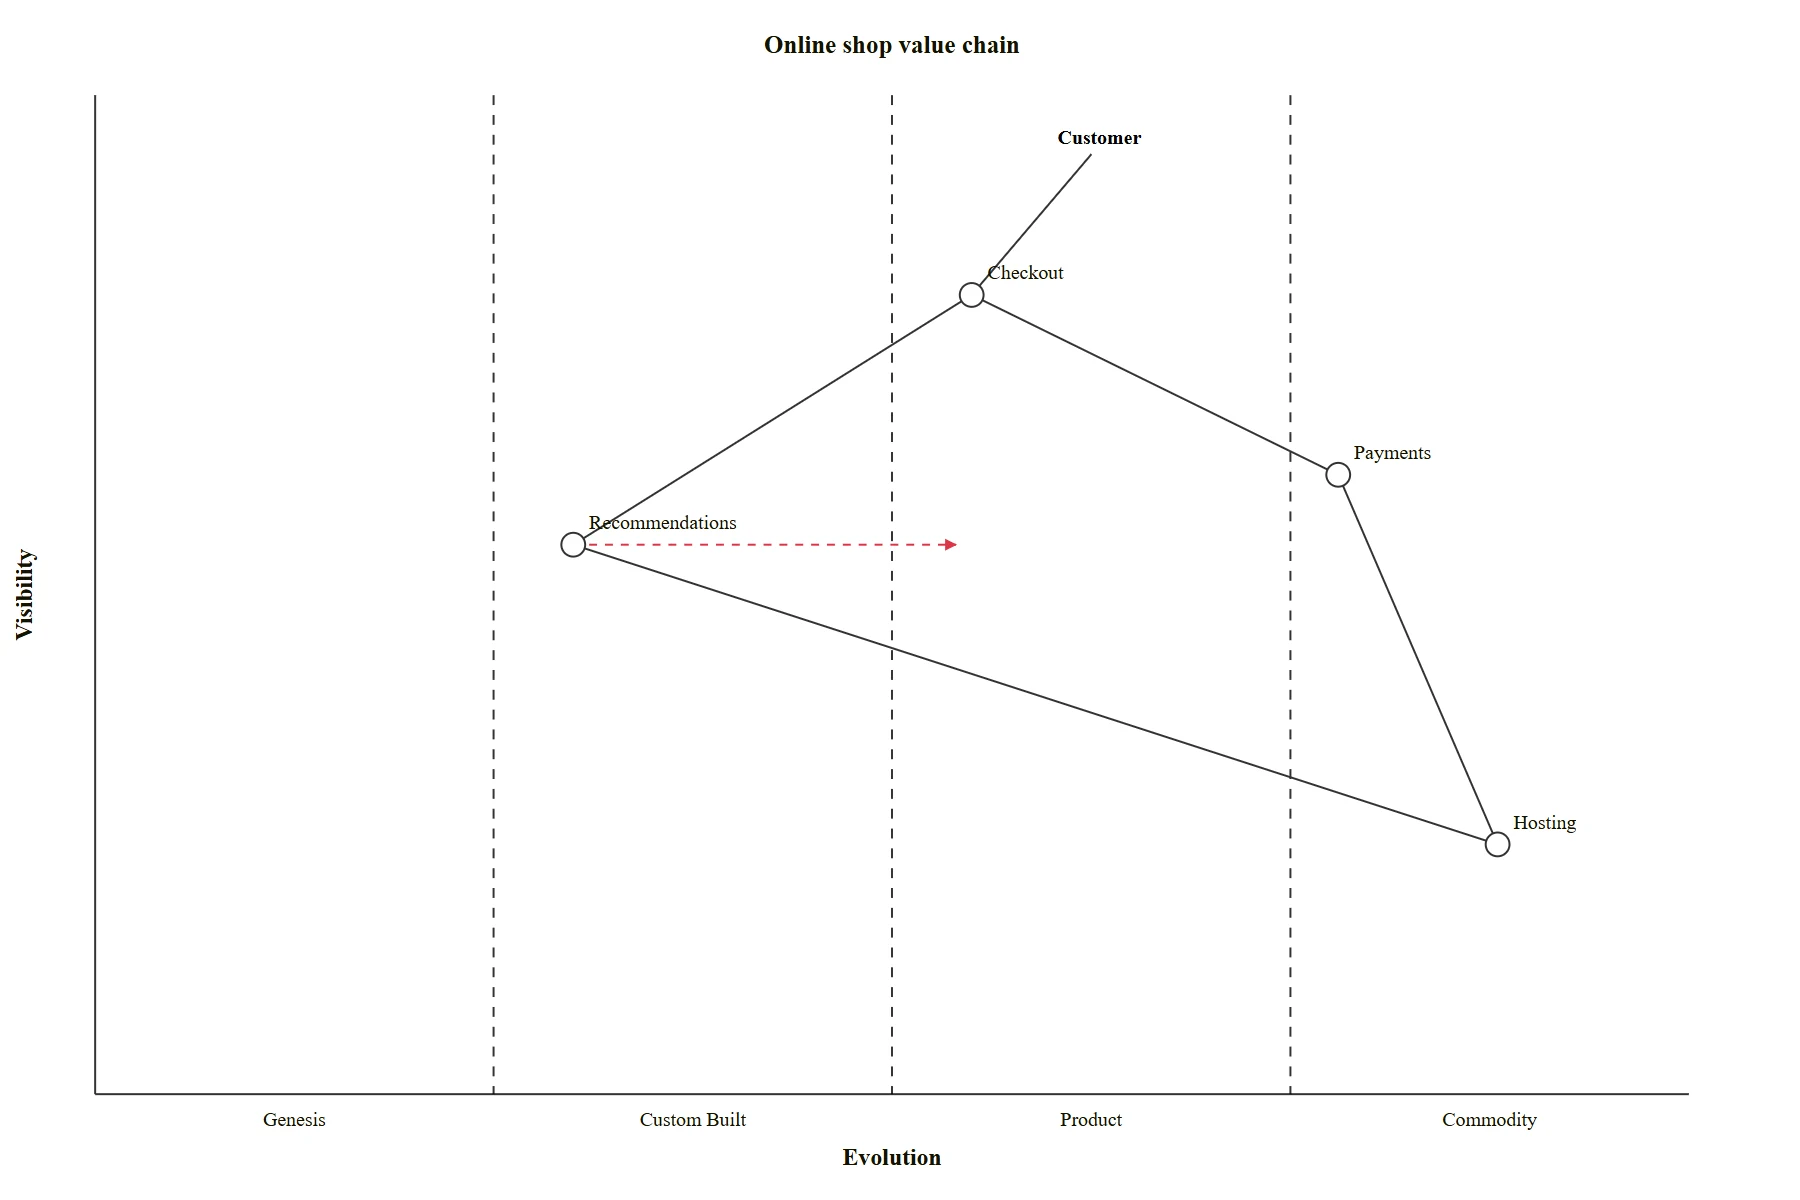
A Wardley map places the components of a value chain by how visible they are to the user (vertical) and how evolved they are, from genesis to commodity (horizontal). It is used for technology and business strategy.

Wardley map example made with Mermaid
Wardley map example, rendered from Mermaid by Arialine

Mermaid code for this example (starts with wardley-beta):

wardley-beta
title Online shop value chain

anchor Customer [0.95, 0.63]
component Checkout [0.80, 0.55]
component Payments [0.62, 0.78]
component Recommendations [0.55, 0.30]
component Hosting [0.25, 0.88]

Customer -> Checkout
Checkout -> Payments
Checkout -> Recommendations
Payments -> Hosting
Recommendations -> Hosting

evolve Recommendations 0.55

Ishikawa (fishbone) diagram

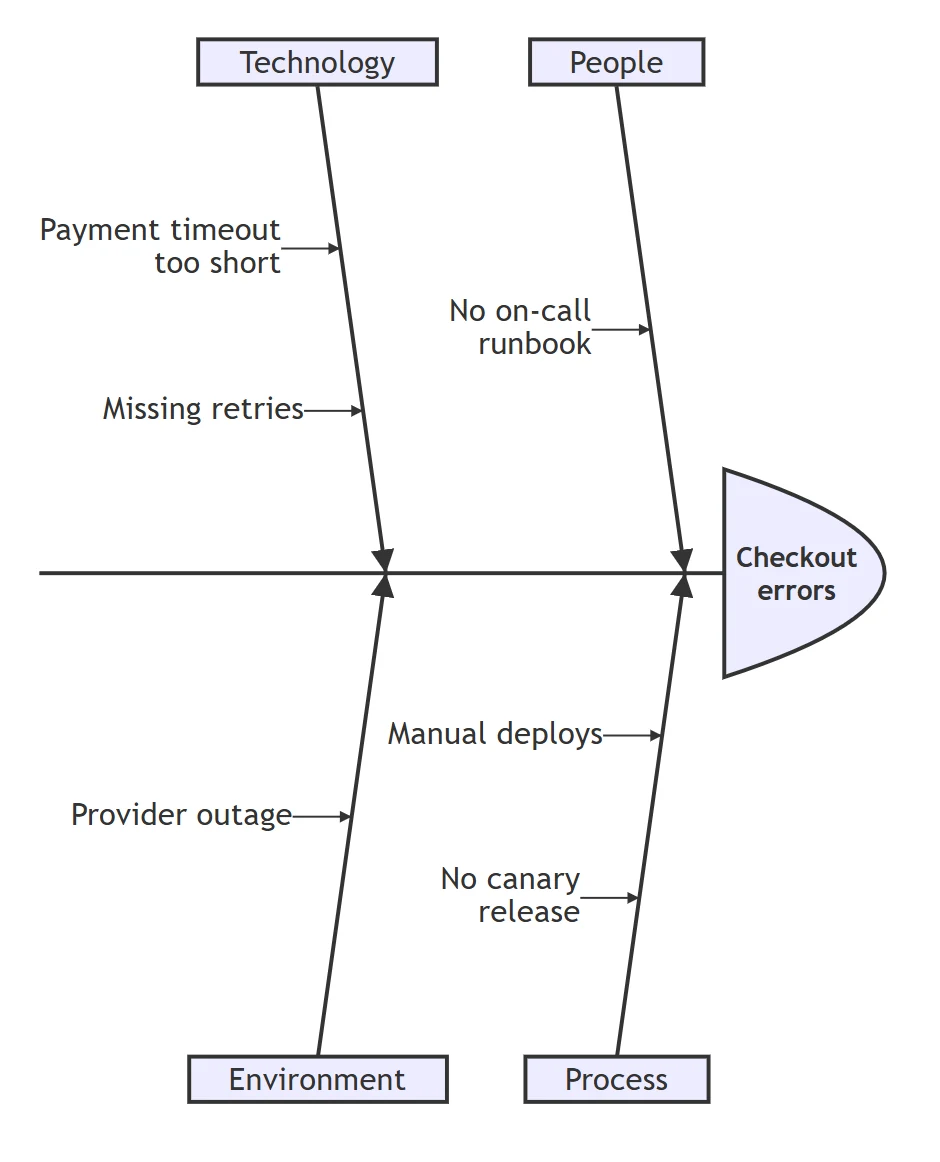
An Ishikawa diagram, also called a fishbone or cause-and-effect diagram, groups the possible causes of a problem into categories along the bones of a fish. It is used in incident postmortems, root cause analysis and quality management.

Ishikawa (fishbone) diagram example made with Mermaid
Ishikawa (fishbone) diagram example, rendered from Mermaid by Arialine

Mermaid code for this example (starts with ishikawa-beta):

ishikawa-beta
    Checkout errors
    People
        No on-call runbook
    Process
        Manual deploys
        No canary release
    Technology
        Payment timeout too short
        Missing retries
    Environment
        Provider outage

Cynefin framework

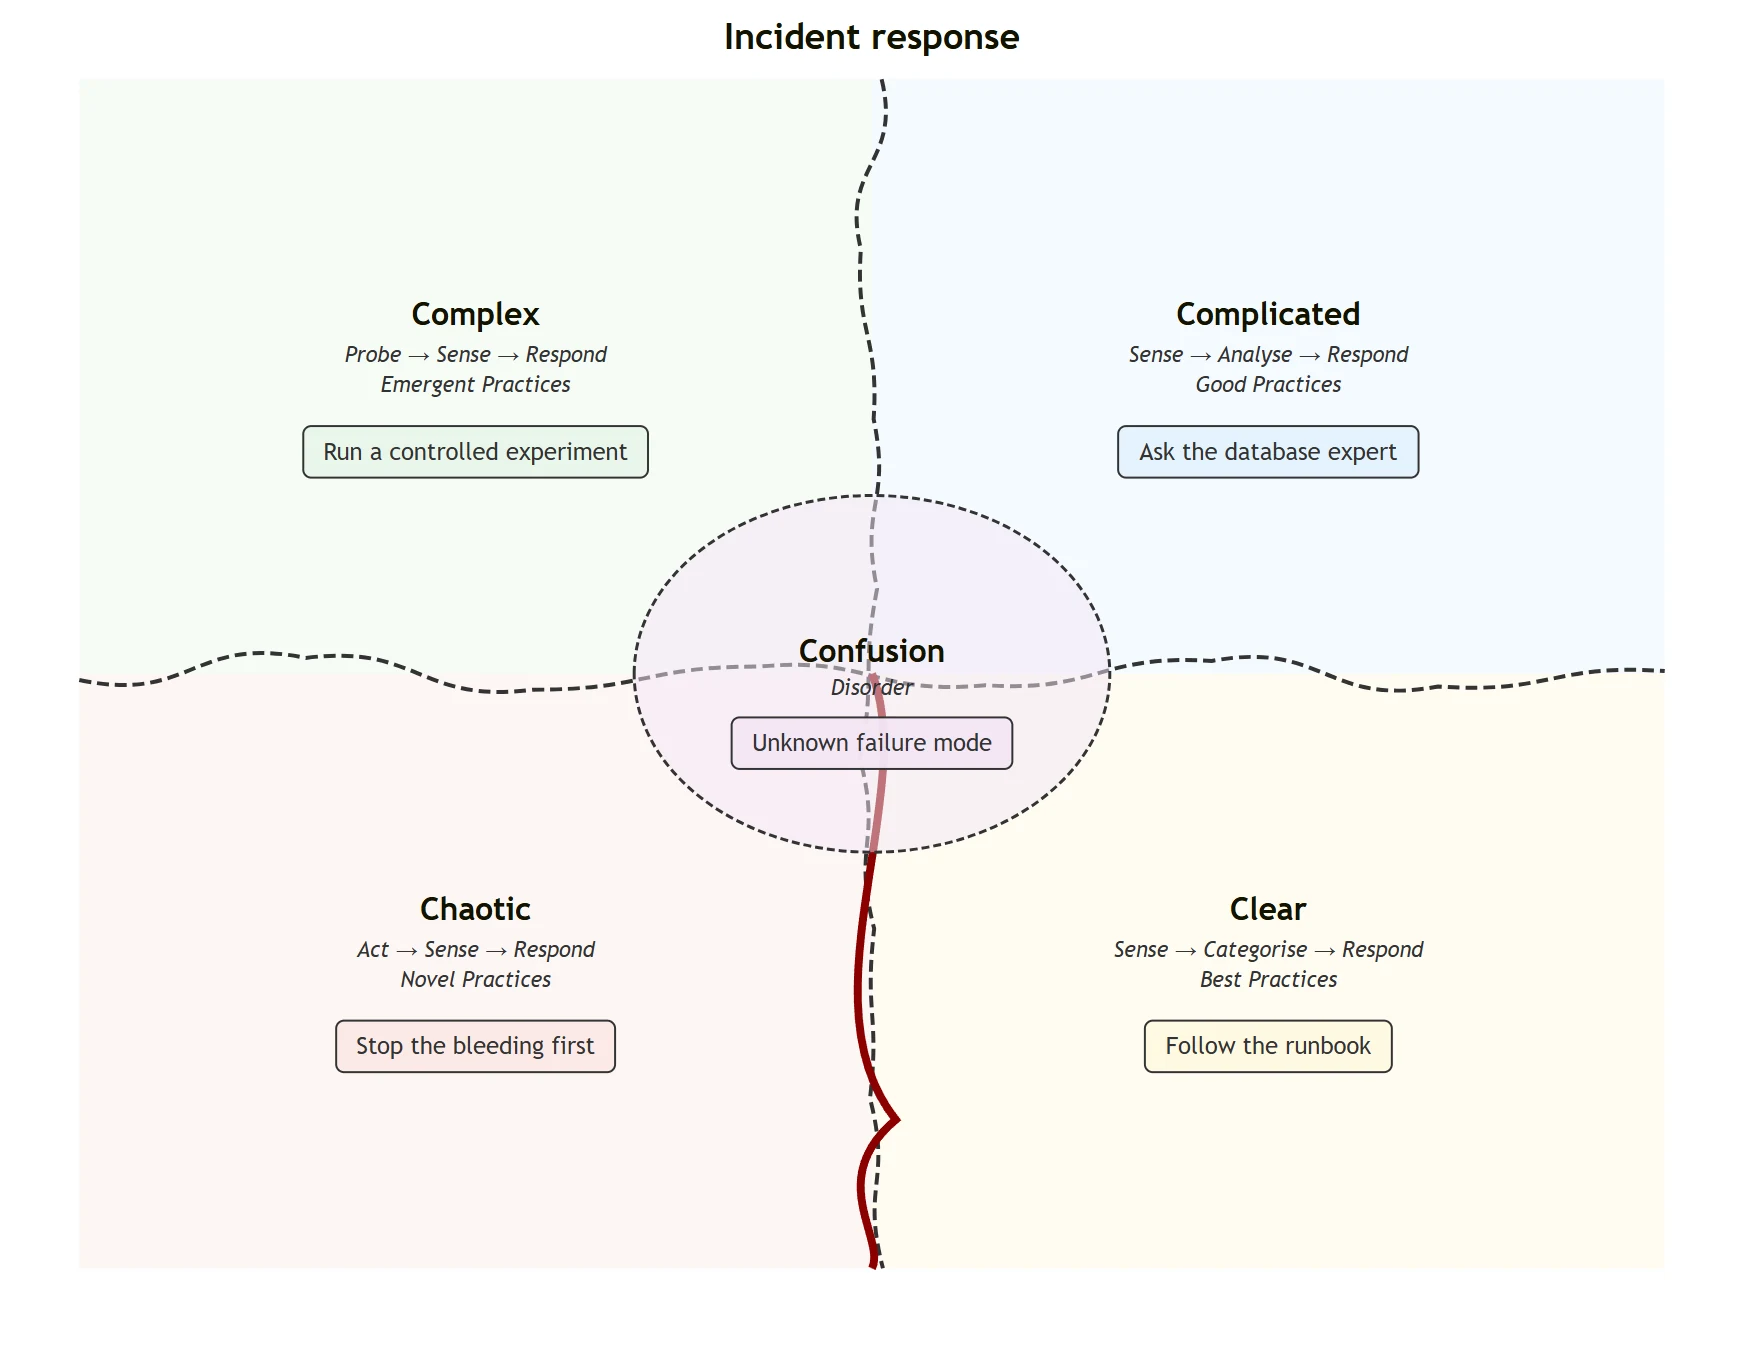
The Cynefin framework sorts situations into clear, complicated, complex, chaotic and confusion domains, each with its own way to respond. Teams use it to decide how to approach a problem or an incident.

Cynefin framework example made with Mermaid
Cynefin framework example, rendered from Mermaid by Arialine

Mermaid code for this example (starts with cynefin-beta):

cynefin-beta
  title Incident response

  complex
    "Run a controlled experiment"

  complicated
    "Ask the database expert"

  clear
    "Follow the runbook"

  chaotic
    "Stop the bleeding first"

  confusion
    "Unknown failure mode"

Quadrant chart

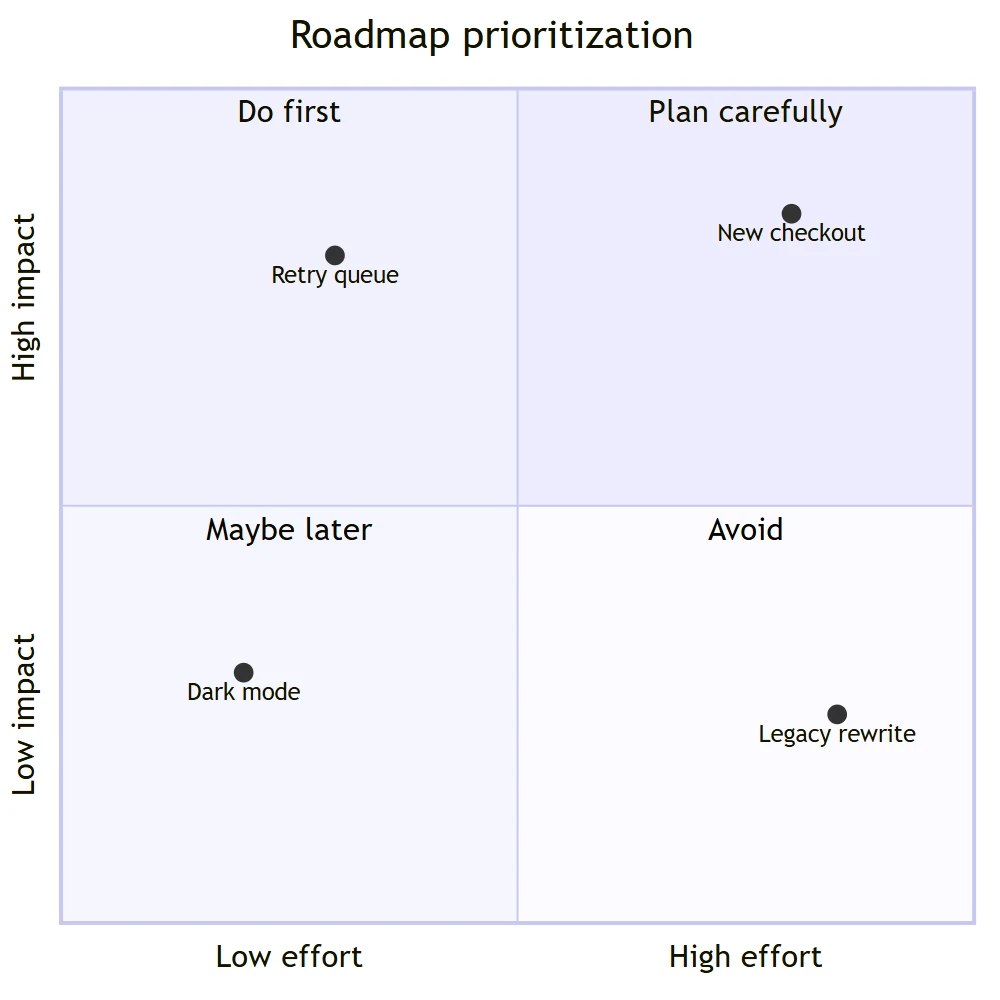
A quadrant chart places items on two axes, such as effort and impact, to split them into four groups. It is used for prioritization matrices, the Eisenhower matrix and competitive analysis.

Quadrant chart example made with Mermaid
Quadrant chart example, rendered from Mermaid by Arialine

Mermaid code for this example (starts with quadrantChart):

quadrantChart
  title Roadmap prioritization
  x-axis Low effort --> High effort
  y-axis Low impact --> High impact
  quadrant-1 Plan carefully
  quadrant-2 Do first
  quadrant-3 Maybe later
  quadrant-4 Avoid
  Retry queue: [0.3, 0.8]
  Dark mode: [0.2, 0.3]
  New checkout: [0.8, 0.85]
  Legacy rewrite: [0.85, 0.25]

Venn diagram

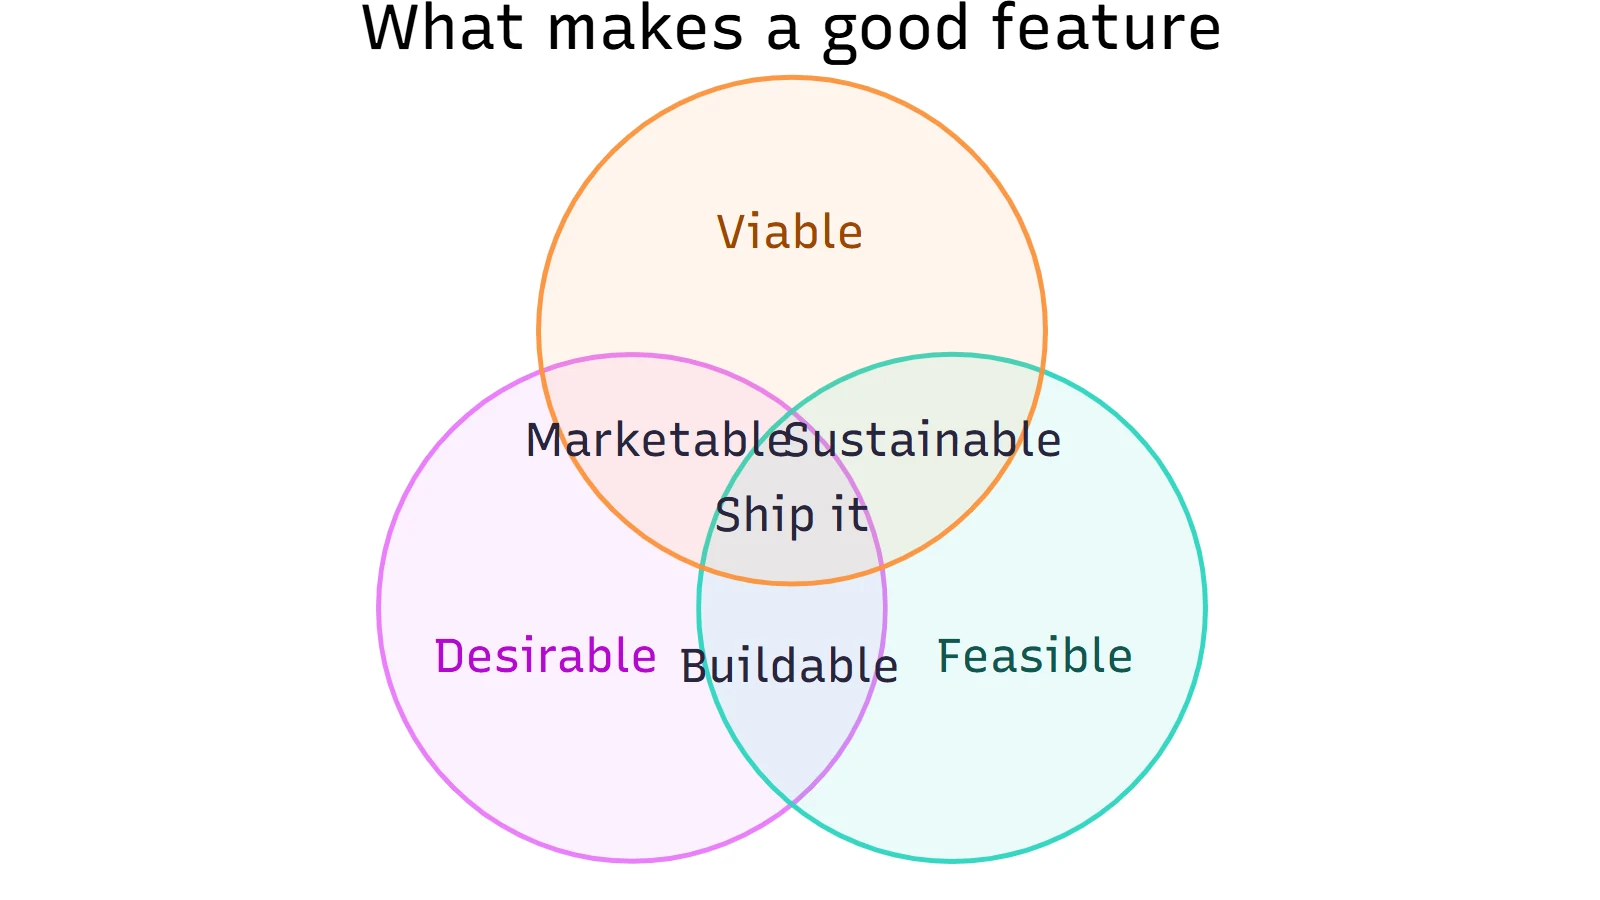
A Venn diagram uses overlapping circles to show what sets have in common and where they differ. It is used to compare options, audiences or requirements.

Venn diagram example made with Mermaid
Venn diagram example, rendered from Mermaid by Arialine

Mermaid code for this example (starts with venn-beta):

venn-beta
  title What makes a good feature
  set Desirable
  set Feasible
  set Viable
  union Desirable,Feasible["Buildable"]
  union Feasible,Viable["Sustainable"]
  union Desirable,Viable["Marketable"]
  union Desirable,Feasible,Viable["Ship it"]

Mind map

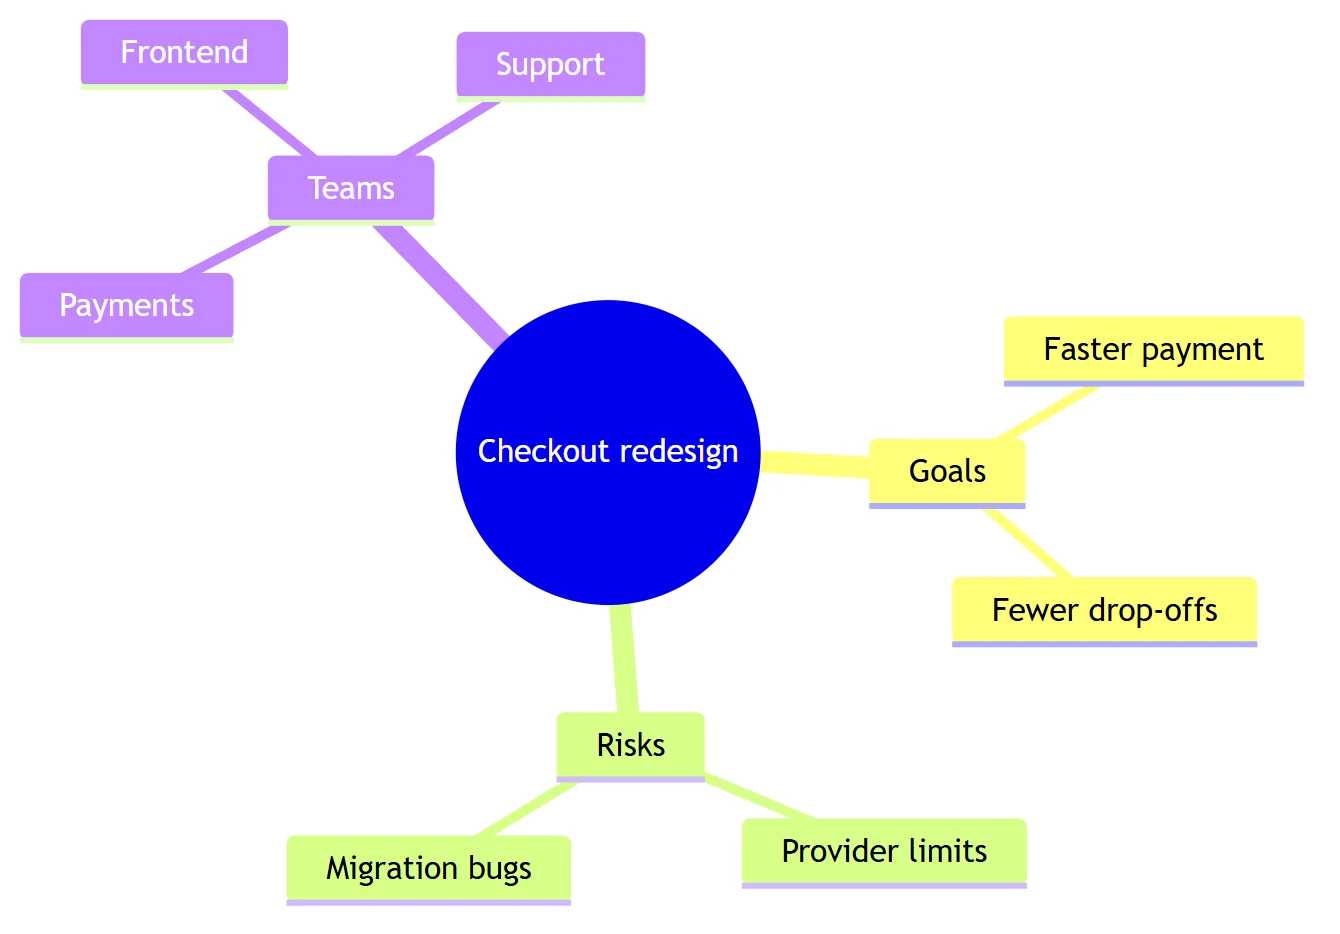
A mind map arranges ideas around a central topic, branching into subtopics. It is used for brainstorming, planning and summarizing a discussion.

Mind map example made with Mermaid
Mind map example, rendered from Mermaid by Arialine

Mermaid code for this example (starts with mindmap):

mindmap
  root((Checkout redesign))
    Goals
      Faster payment
      Fewer drop-offs
    Risks
      Provider limits
      Migration bugs
    Teams
      Payments
      Frontend
      Support
6Diagram types

Data and structure

Charts and structures for numbers, hierarchies and work in progress.

Pie chart

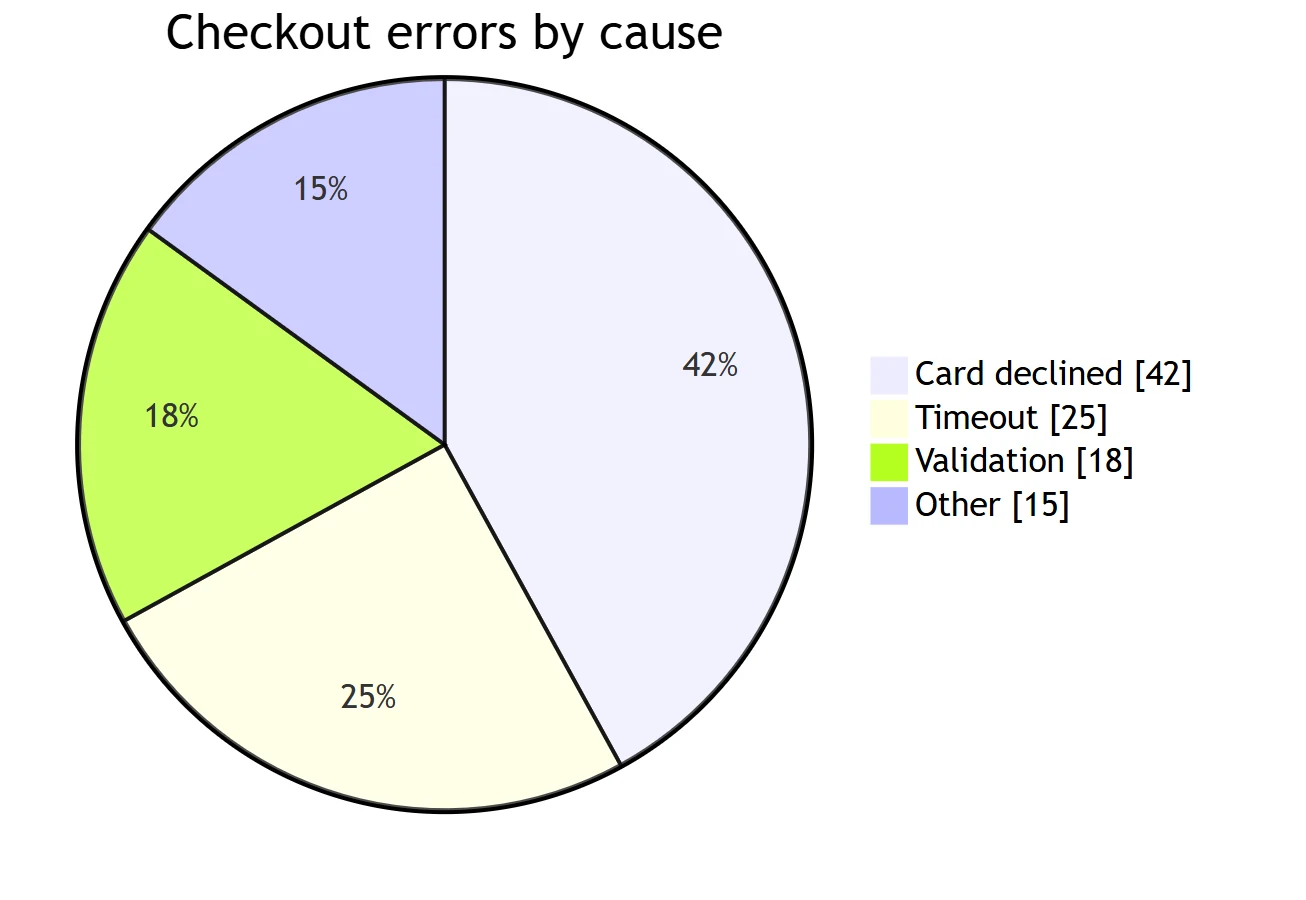
A pie chart shows how a whole is divided into parts, with each slice proportional to its value. It suits simple breakdowns such as error causes or budget shares.

Pie chart example made with Mermaid
Pie chart example, rendered from Mermaid by Arialine

Mermaid code for this example (starts with pie):

pie showData
  title Checkout errors by cause
  "Card declined" : 42
  "Timeout" : 25
  "Validation" : 18
  "Other" : 15

Sankey diagram

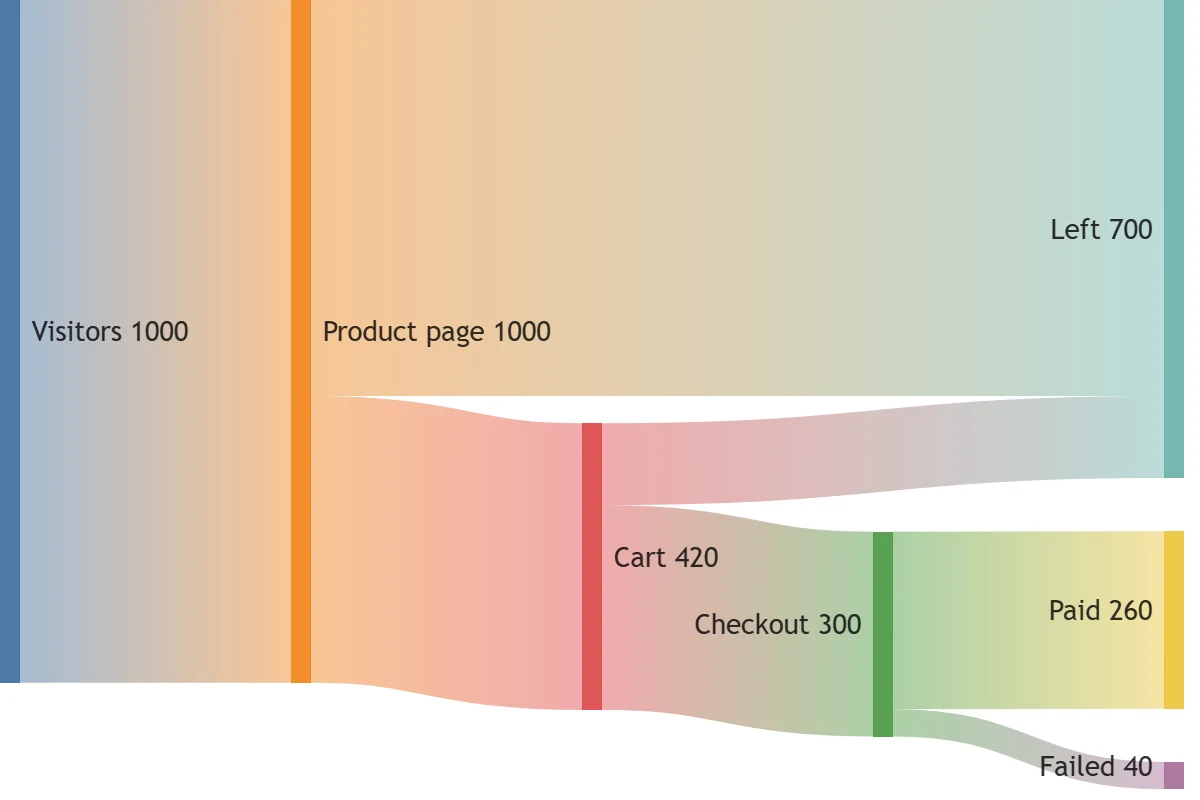
A Sankey diagram shows flows between stages, with the width of each band proportional to the amount. It is used for conversion funnels, energy flows and budget allocation.

Sankey diagram example made with Mermaid
Sankey diagram example, rendered from Mermaid by Arialine

Mermaid code for this example (starts with sankey):

sankey
Visitors,Product page,1000
Product page,Cart,420
Product page,Left,580
Cart,Checkout,300
Cart,Left,120
Checkout,Paid,260
Checkout,Failed,40

XY chart

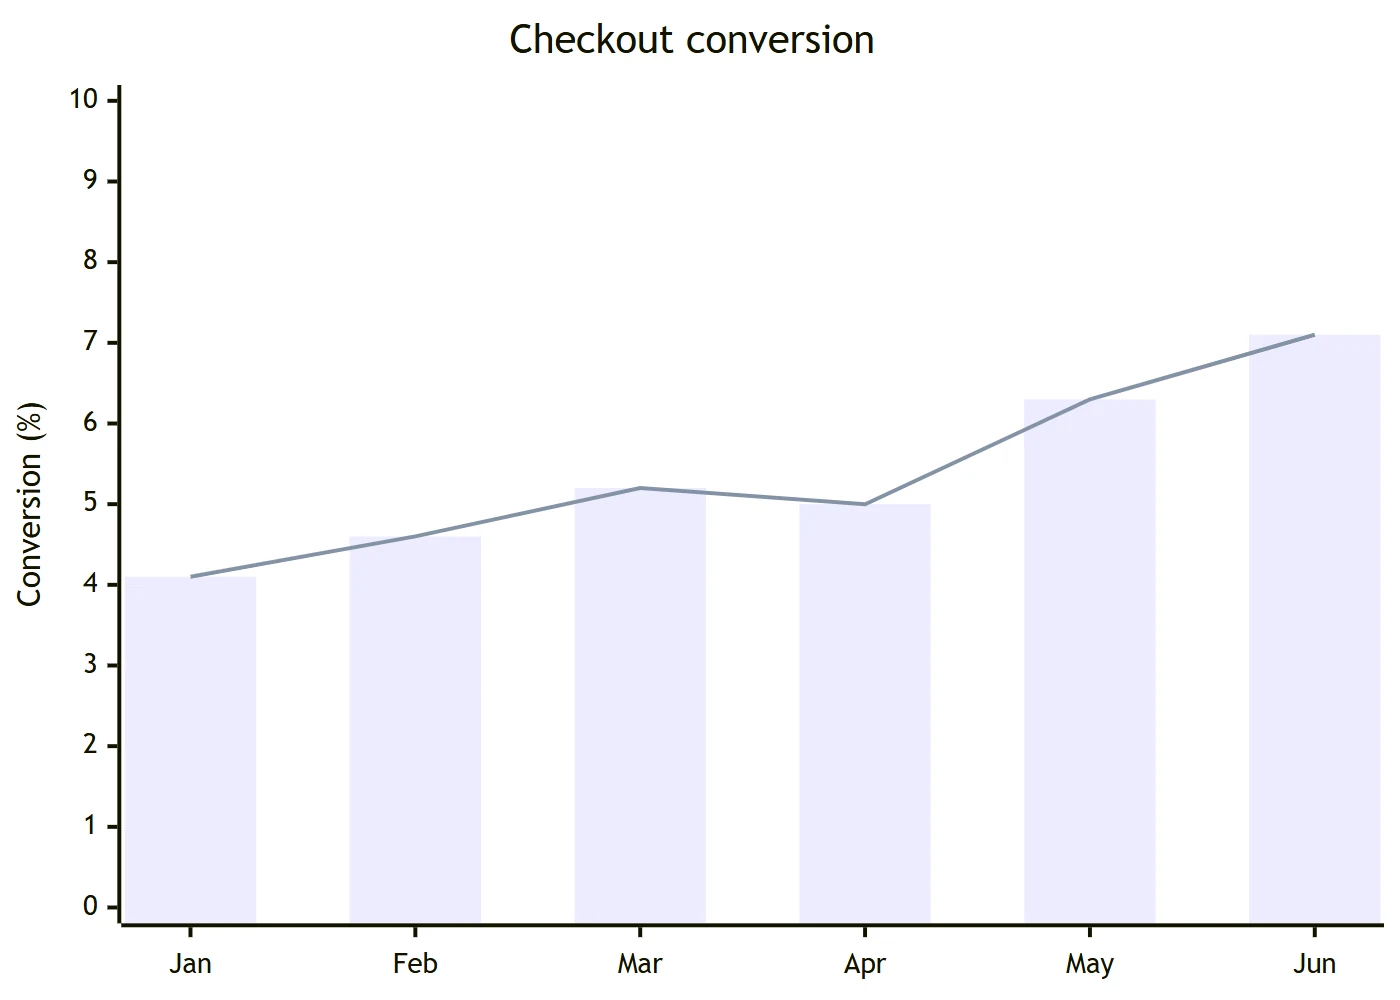
An XY chart plots values on an x and y axis as bars, lines or both. It is used for metrics over time such as conversion, latency or revenue.

XY chart example made with Mermaid
XY chart example, rendered from Mermaid by Arialine

Mermaid code for this example (starts with xychart):

xychart
  title "Checkout conversion"
  x-axis [Jan, Feb, Mar, Apr, May, Jun]
  y-axis "Conversion (%)" 0 --> 10
  bar [4.1, 4.6, 5.2, 5.0, 6.3, 7.1]
  line [4.1, 4.6, 5.2, 5.0, 6.3, 7.1]

Radar chart

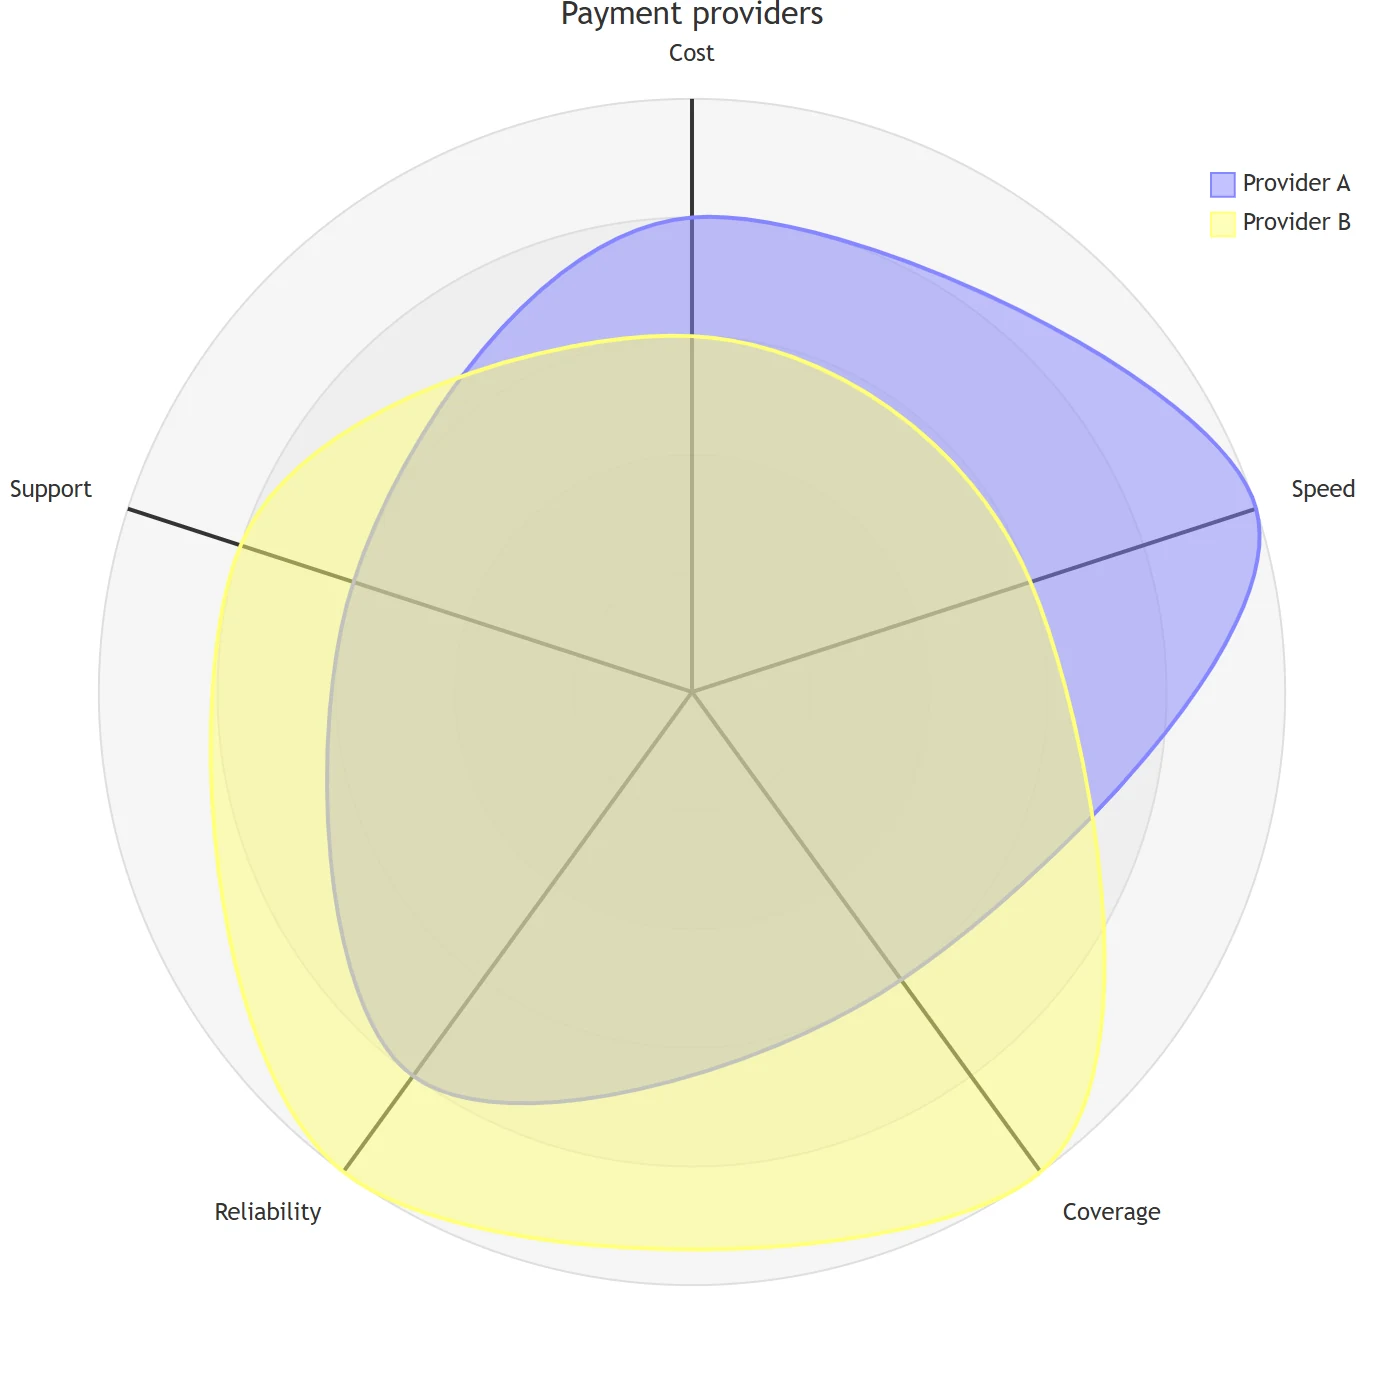
A radar chart (spider chart) compares several items across the same set of criteria, one axis per criterion. It is used to compare vendors, skills or product options.

Radar chart example made with Mermaid
Radar chart example, rendered from Mermaid by Arialine

Mermaid code for this example (starts with radar-beta):

radar-beta
  title Payment providers
  axis Cost, Speed, Coverage, Reliability, Support
  curve a["Provider A"]{4, 5, 3, 4, 3}
  curve b["Provider B"]{3, 3, 5, 5, 4}

Treemap

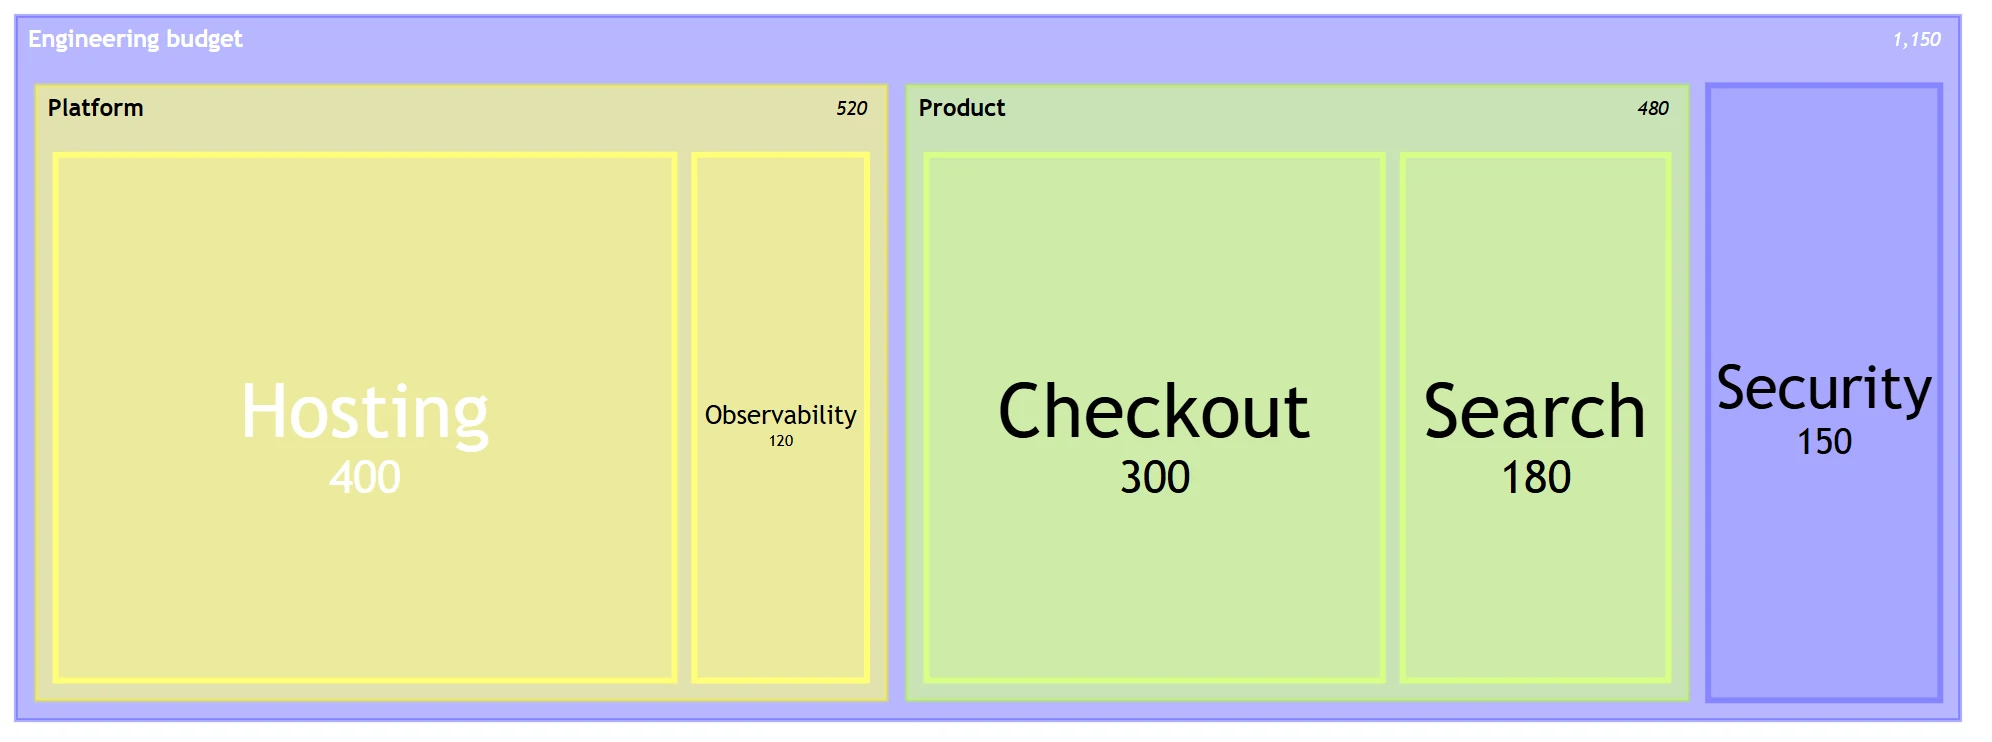
A treemap shows hierarchical data as nested rectangles, with each rectangle's area proportional to its value. It is used for budgets, disk usage and portfolio breakdowns.

Treemap example made with Mermaid
Treemap example, rendered from Mermaid by Arialine

Mermaid code for this example (starts with treemap-beta):

treemap-beta
"Engineering budget"
    "Platform"
        "Hosting": 400
        "Observability": 120
    "Product"
        "Checkout": 300
        "Search": 180
    "Security": 150

Git graph

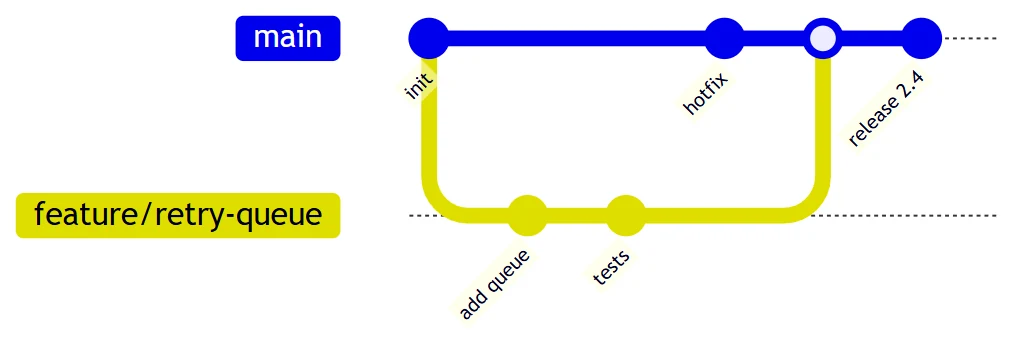
A Git graph shows commits, branches and merges in a repository. Teams use it to explain branching strategies and release flows.

Git graph example made with Mermaid
Git graph example, rendered from Mermaid by Arialine

Mermaid code for this example (starts with gitGraph):

gitGraph
  commit id: "init"
  branch feature/retry-queue
  commit id: "add queue"
  commit id: "tests"
  checkout main
  commit id: "hotfix"
  merge feature/retry-queue
  commit id: "release 2.4"

Kanban board

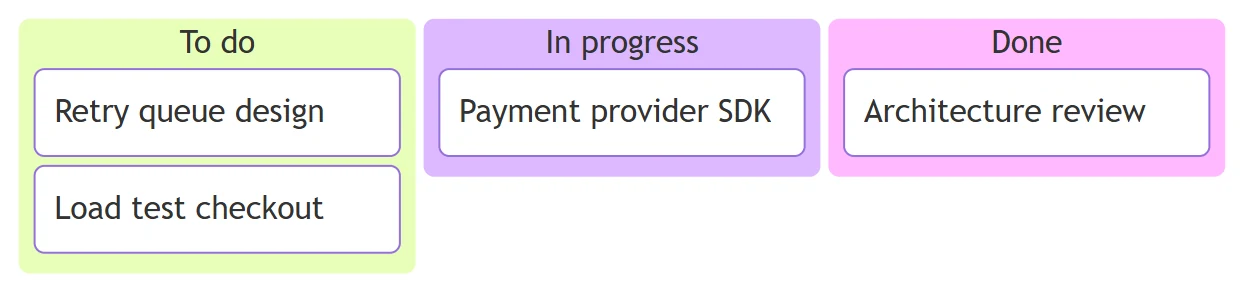
A kanban diagram shows work items as cards in columns such as To do, In progress and Done. It gives a quick snapshot of a team's work in a document or a Slack thread.

Kanban board example made with Mermaid
Kanban board example, rendered from Mermaid by Arialine

Mermaid code for this example (starts with kanban):

kanban
  todo[To do]
    t1[Retry queue design]
    t2[Load test checkout]
  doing[In progress]
    t3[Payment provider SDK]
  done[Done]
    t4[Architecture review]

Tree view

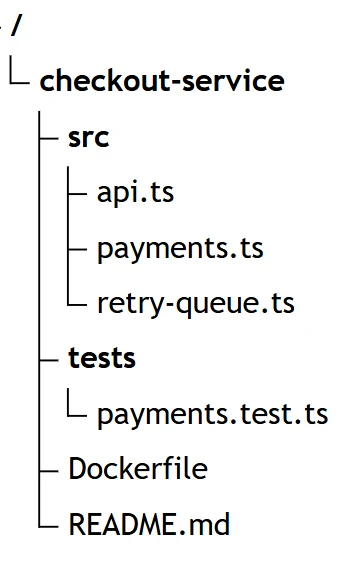
A tree view diagram shows a hierarchy such as folders and files, the way a file explorer does. It is used to document project structure and repository layouts.

Tree view example made with Mermaid
Tree view example, rendered from Mermaid by Arialine

Mermaid code for this example (starts with treeView-beta):

treeView-beta
    checkout-service/
        src/
            api.ts
            payments.ts
            retry-queue.ts
        tests/
            payments.test.ts
        Dockerfile
        README.md

Agent flow diagram

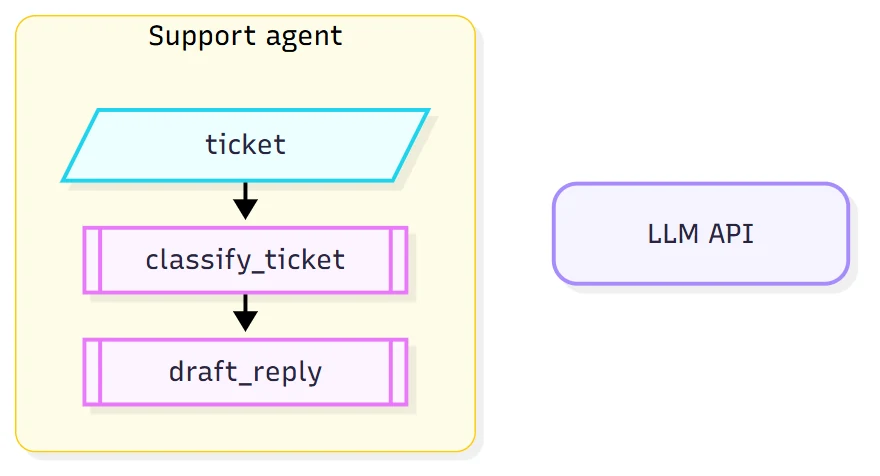
An agent flow diagram shows how an AI agent pipeline works: inputs, tools, model calls and the data passed between them. It is used to design and document LLM agents.

Agent flow diagram example made with Mermaid
Agent flow diagram example, rendered from Mermaid by Arialine

Mermaid code for this example (starts with agentflow-beta):

agentflow-beta TB
  connector llm["LLM API"]
  flow support["Support agent"]
    ticket["ticket"]@{ shape: input, value: "Customer email" }
    classify["classify_ticket"]@{ shape: tool, returns: "Category" }
    draft["draft_reply"]@{ shape: tool, connectorRef: "llm.chat", returns: "Reply" }
    ticket --> classify --> draft
  end

Use any of these types in Slack

Type /arialine followed by the Mermaid code, mention @arialine with a ```mermaid block, or share a .mmd file. Valid Mermaid is rendered exactly as written, without AI and without a limit. To draw a type without writing the syntax, describe it: “a fishbone diagram of why checkout errors went up”.

FAQ

Frequently asked

How many diagram types does Mermaid have?+

Mermaid 12 has 32 diagram types, from flowchart, sequence, class, state and ER diagrams to newer ones such as swimlane, use case, Venn, Ishikawa, Wardley map, Cynefin, tree view, railroad and agent flow. ZenUML adds a code-style sequence diagram as a plugin. This page shows an example of each.

Which Mermaid version does Arialine use?+

Mermaid 12 with the ZenUML plugin, for validation, PNG and SVG export, the interactive HTML file and PDF reports.

Can I make a swimlane diagram in Slack?+

Yes. Paste swimlane-beta Mermaid, or describe the process and its lanes and Arialine writes it. Teammates can then add steps by replying in the diagram's thread.

Can Arialine draw C4 diagrams?+

Yes: C4Context, C4Container, C4Component, C4Dynamic and C4Deployment render in Slack like any other Mermaid diagram, with version history for each change.

Does it support Wardley maps and fishbone diagrams?+

Yes. Wardley maps (wardley-beta) and Ishikawa or fishbone diagrams (ishikawa-beta) are supported in Mermaid 12, and Arialine can generate them from a description.

Do I have to paste the full syntax?+

No. Describe the diagram in any language and Arialine writes the Mermaid. Pasting valid Mermaid simply skips the AI and renders it as written.

Try it in your workspace

Every feature is included in Free, with up to 3 boards and 10 AI generations per workspace each day. Model-free actions do not use that daily allowance. Workspace approval may be required.